Home / Fri 09 Aug 2024 Market Recap
09 Aug 2024: Nifty Closed at ₹24,363.75 (+1.02%), Cipla closing higher for the past 4 days & Cera Sanitaryware for 5 days!
Show Table of Contents
Table of Contents
- 1: Top Indices Performance Overview
- 2: Nifty 50 Performance Overview
- 2.1: Nifty 50 Top Gainers
- 2.2: Nifty 50 Top Losers
- 2.3: Nifty 50 Stocks To Watch for Tomorrow
- 2.3.1: ➲ Cipla (Bullish Pattern)
- 2.3.2: ➲ Britannia (Bearish Trend)
- 3: Nifty 500 Performance Overview
- 3.1: Nifty 500 Top Gainers
- 3.2: Nifty 500 Top Losers
- 3.3: Nifty 51 to 500 Stocks To Watch for Tomorrow
- 3.3.1: Cera Sanitaryware: A Bullish Outlook
- 3.3.2: ➲ Bata India (Bearish Trend)
- 4: Top Stocks That Created a New All Time High Today
- 4.1: Top Large Cap Stocks That Created a New All Time High Today
- 4.2: Top Mid Cap Stocks That Created a New All Time High Today
- 4.3: Top Small Cap Stocks That Created a New All Time High Today
Top Indices Performance Overview
| Stock | Close | Range |
|---|---|---|
| NIFTY 50 | ₹24,363.75 (1.02%) | ₹24,312.19 – ₹24,419.59 |
| NIFTY BANK | ₹50,481.8 (0.64%) | ₹50,391.89 – ₹50,707.75 |
| NIFTY FIN SERVICE | ₹22,983.84 (0.63%) | ₹22,948.8 – ₹23,088.55 |
| NIFTY IT | ₹39,043.3 (1.54%) | ₹38,931.85 – ₹39,252.39 |
| NIFTY AUTO | ₹25,371.59 (1.82%) | ₹25,204.44 – ₹25,444.8 |
| NIFTY ENERGY | ₹43,216.05 (1.23%) | ₹43,018.14 – ₹43,426.3 |
Nifty 50 Performance Overview
The Nifty 50 kicked off the day at ₹24,386.84, showcasing a bit of a roller coaster ride. It dipped to a low of ₹24,312.19, but rallied to a high of ₹24,419.59 before settling at ₹24,363.75 for the day, closing up 1.02% .
Take a look at the top gainers and losers today to see how their performance impacted the Nifty 50’s overall movement.
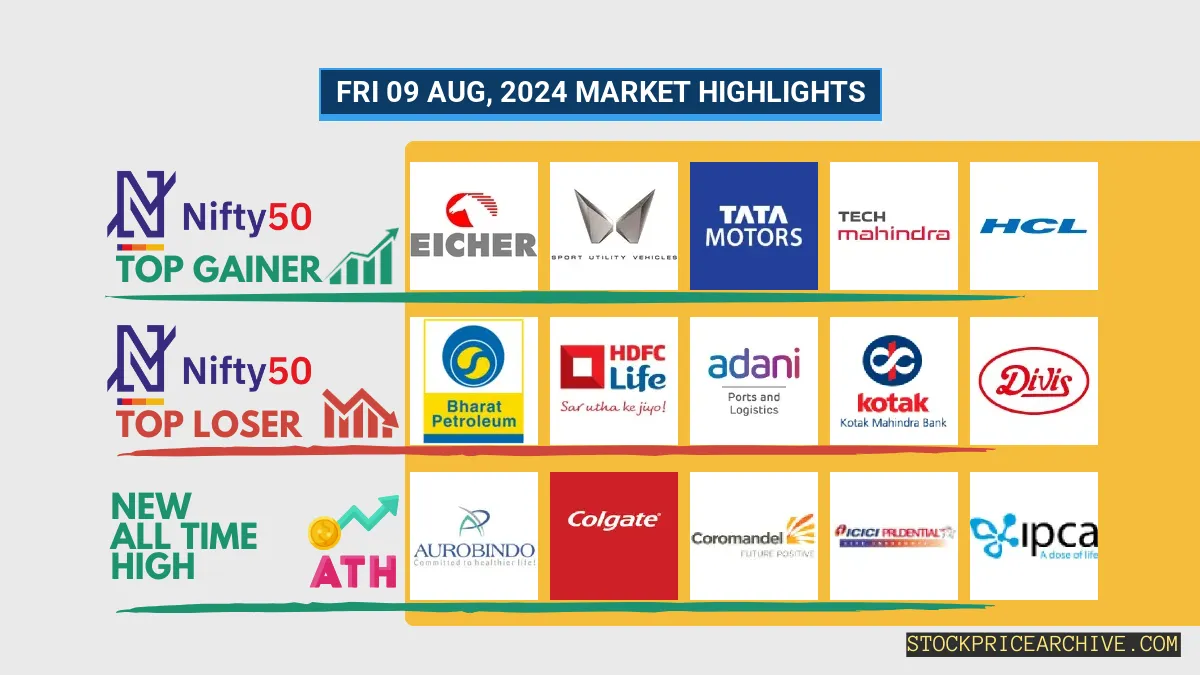
Nifty 50 Top Gainers
| Stock | Close | Range |
|---|---|---|
| Eicher Motors | ₹4835 (5.63%) | ₹4,716.95 – ₹4853 |
| Mahindra & Mahindra | ₹2764 (3.02%) | ₹2720 – ₹2,764.5 |
| Tata Motors | ₹1071 (2.8%) | ₹1,052.15 – ₹1,082.69 |
| Tech Mahindra | ₹1506 (2.69%) | ₹1,484.5 – ₹1,509.05 |
| HCL | ₹1,593.75 (2.3%) | ₹1579 – ₹1602 |
Nifty 50 Top Losers
| Stock | Close | Range |
|---|---|---|
| Bharat Petroleum | ₹333.39 (-1.45%) | ₹330 – ₹336.7 |
| HDFC Life | ₹702.4 (-1.12%) | ₹701.45 – ₹715 |
| Adani Ports | ₹1532 (-0.77%) | ₹1519 – ₹1541 |
| Kotak Mahindra Bank | ₹1,769.84 (-0.17%) | ₹1,765.4 – ₹1,784.94 |
| Divis Lab | ₹4829 (-0.12%) | ₹4,820.5 – ₹4,900.45 |
Nifty 50 Stocks To Watch for Tomorrow
➲ Cipla (Bullish Pattern)
- Performance Overview: Cipla’s stock performance over the last 26 trading sessions has been pretty positive, closing higher 15 times and lower 11 times.
- Recent Trend: Cipla has been on a roll, closing higher for the past 4 trading days – not a single red day since Monday, August 5th, 2024!
- Returns: This positive momentum has translated into solid returns for investors. In the last 26 sessions, Cipla has generated a 6.56% return. That means an investment of ₹10,000 would have grown to ₹10,655.99.
- Financial Insight: Over the past 12 months, Cipla has brought in a significant revenue of ₹25,892.19 Crore and turned a healthy profit of ₹4,303.48 Crore.
- As of Friday, August 9th, 2024, Cipla has a Market Capital of ₹1,23,710.11 Crore.
- Summary: Cipla’s stock is showing a strong bullish pattern. Keep an eye on its price movements and consider both short-term and long-term growth opportunities. Check out the potential targets for tomorrow and for the years ahead: Cipla Target for Tomorrow and Cipla Targets for 2024 & 2025.
Cipla Financial Performance
| Metric | Value | Description |
|---|---|---|
| Market Capital | 1,23,710.11 Crore | Market valuation of Cipla’s shares. |
| Revenue (TTM) | 25,892.19 Crore | Total revenue generated by Cipla over the past twelve months. |
| Net Income (TTM) | +4,303.48 Crore | Net Profit or Loss after all the expenses over the past twelve months. |
| Operating Margin | 22.17% | Income from operations as a percentage of revenue, before taxes and interest. |
| Profit Margin | 16.62% | Net income as a percentage of revenue, after all expenses. |
| Revenue Growth (Quarterly) | +5.7% | Change in revenue compared to the previous quarter. |
| Earnings Growth (YOY Quarterly) | +18.3% | Change in earnings compared to the same quarter last year. |
| Debt-to-Equity (D/E) Ratio | 2.09 | Company’s total debt divided by total shareholder equity. |
| Total Debt | 560.29 Crore | Sum of Cipla’s current & long-term financial obligations. |
| Total Cash | 7,970.95 Crore | Total amount of liquid funds available to Cipla. |
| Beta | 0.37 | Beta is less than 1 indicating that the Cipla’s price is less volatile than the market. |
➲ Britannia (Bearish Trend)
- Performance Overview: Over the past 26 trading days, Britannia has closed higher 15 times and lower 10 times. This suggests a mixed performance, but recent trends point to a bearish outlook.
- Recent Trend: Britannia has experienced a three-day downturn, closing lower each day since Tuesday, August 6, 2024.
- Returns: In the last 26 trading sessions, Britannia has yielded a 5.23% return. This means that a ₹10,000 investment would have grown to ₹10,523 during this period.
- Financial Insight: Britannia’s financial performance shows strength. Over the past 12 months, the company generated a revenue of ₹16,957.76 Crore and recorded a profit of ₹2,187.89 Crore.
- As of Friday, August 9, 2024, Britannia holds a Market Capital of ₹1,41,091.69 Crore.
- Summary: Britannia is currently in a bearish phase, prompting investors to stay vigilant. Keep an eye on Britannia’s Target for Tomorrow and Britannia’s Target Price Projections for 2024 and 2025 for insights into its potential direction.
Britannia Financial Performance
| Metric | Value | Description |
|---|---|---|
| Market Capital | 1,41,091.69 Crore | Market valuation of Britannia’s shares. |
| Revenue (TTM) | 16,957.76 Crore | Total revenue generated by Britannia over the past twelve months. |
| Net Income (TTM) | +2,187.89 Crore | Net Profit or Loss after all the expenses over the past twelve months. |
| Operating Margin | 15.99% | Income from operations as a percentage of revenue, before taxes and interest. |
| Profit Margin | 12.9% | Net income as a percentage of revenue, after all expenses. |
| Revenue Growth (Quarterly) | +6% | Change in revenue compared to the previous quarter. |
| Earnings Growth (YOY Quarterly) | +10.5% | Change in earnings compared to the same quarter last year. |
| Debt-to-Equity (D/E) Ratio | 52.06 | Company’s total debt divided by total shareholder equity. |
| Total Debt | 2,064.95 Crore | Sum of Britannia’s current & long-term financial obligations. |
| Total Cash | 2,019.3 Crore | Total amount of liquid funds available to Britannia. |
| Beta | 0.52 | Beta is less than 1 indicating that the Britannia’s price is less volatile than the market. |
Nifty 500 Performance Overview
The Nifty 500 started the day at ₹22,940.3, showing some volatility throughout the session. It dipped to a low of ₹22,869.5 but climbed to a high of ₹22,982.34 before ultimately closing at ₹22,921.94, a positive gain of 0.95%.
This movement was influenced by a mix of top gainers and losers, which you can see in the table below.
Nifty 500 Top Gainers
| Stock | Close | Range |
|---|---|---|
| Kfin Technologies | ₹1,090.8 (19.99%) | ₹916.09 – ₹1,090.8 |
| Avanti Feeds | ₹771.29 (15.42%) | ₹674 – ₹793 |
| NBCC | ₹184.55 (9.15%) | ₹169.58 – ₹188.35 |
| Godfrey Phillips | ₹4448 (7.75%) | ₹4170 – ₹4455 |
| Bombay Burmah Trading Corp | ₹2,363.35 (5.75%) | ₹2,266.25 – ₹2412 |
Nifty 500 Top Losers
| Stock | Close | Range |
|---|---|---|
| Alembic Pharma | ₹1,137.05 (-6.34%) | ₹1,121.33 – ₹1,219.3 |
| Steel Authority of India | ₹129.19 (-6.01%) | ₹128.88 – ₹137.16 |
| Timken India | ₹3953 (-5.49%) | ₹3,929.85 – ₹4,104.89 |
| Lemon Tree Hotels | ₹119.69 (-5.19%) | ₹119.36 – ₹128.81 |
| MEDANTA (Global Health) | ₹1,132.65 (-4.94%) | ₹1129 – ₹1,187.94 |
Nifty 51 to 500 Stocks To Watch for Tomorrow
Cera Sanitaryware: A Bullish Outlook
- Performance Overview: Over the last 26 trading sessions (ending on August 9, 2024), Cera Sanitaryware has closed higher 16 times and lower 10 times. This indicates a positive trend, with more days ending in green than red.
- Recent Trend: Cera Sanitaryware has enjoyed a strong five-day green streak, showing consistent upward momentum since August 2nd, 2024.
- Returns: Cera Sanitaryware has delivered impressive returns, generating a 15.95% gain in the last 26 trading sessions. This means an initial investment of ₹10,000 would have grown to ₹11,595.
- Financial Insight: In the past year, Cera Sanitaryware has generated a revenue of ₹1,879.41 Crore and earned a profit of ₹239 Crore. These strong financials suggest a healthy business performance.
- As of August 9, 2024, Cera Sanitaryware boasts a Market Capitalization of ₹11,607.83 Crore, reflecting its size and investor confidence.
- Summary: Cera Sanitaryware is currently exhibiting a bullish pattern. Its recent performance and financial strength make it a promising investment option. If you’re considering Cera Sanitaryware for your portfolio, you can explore short-term and long-term targets by visiting the links below: Checkout Cera Sanitaryware Target for Tomorrow and Cera Sanitaryware Targets for 2024 & 2025.
Cera Sanitaryware Financial Performance
| Metric | Value | Description |
|---|---|---|
| Market Capital | 11,607.83 Crore | Market valuation of Cera Sanitaryware’s shares. |
| Revenue (TTM) | 1,879.41 Crore | Total revenue generated by Cera Sanitaryware over the past twelve months. |
| Net Income (TTM) | +239 Crore | Net Profit or Loss after all the expenses over the past twelve months. |
| Operating Margin | 15.62% | Income from operations as a percentage of revenue, before taxes and interest. |
| Profit Margin | 12.71% | Net income as a percentage of revenue, after all expenses. |
| Revenue Growth (Quarterly) | +1.7% | Change in revenue compared to the previous quarter. |
| Earnings Growth (YOY Quarterly) | +19.4% | Change in earnings compared to the same quarter last year. |
| Debt-to-Equity (D/E) Ratio | 3.27 | Company’s total debt divided by total shareholder equity. |
| Total Debt | 44.46 Crore | Sum of Cera Sanitaryware’s current & long-term financial obligations. |
| Total Cash | 809.65 Crore | Total amount of liquid funds available to Cera Sanitaryware. |
| Beta | -0.03 | Beta is less than 1 indicating that the Cera Sanitaryware’s price is less volatile than the market. |
➲ Bata India (Bearish Trend)
- Performance Overview: Over the last 26 trading days, Bata India has closed lower 14 times and higher 12 times.
- Recent Trend: Bata India has been on a 6-day losing streak, with no closing gains since Thursday, August 1st, 2024.
- Returns: Bata India has seen a -3.88% return over the past 26 trading sessions. This means an investment of ₹10,000 would be worth ₹9,612 today.
- Financial Insight: In the last 12 months, Bata India generated ₹3,478.6 Crore in revenue and achieved a profit of ₹262.51 Crore.
- As of Friday, August 9th, 2024, Bata India has a Market Capital of ₹19,473.27 Crore.
- Summary: Bata India is currently showing a bearish trend. Investors might want to keep a close eye on the stock, particularly the Bata India Target for Tomorrow and Bata India Targets for 2024 & 2025.
Bata India Financial Performance
| Metric | Value | Description |
|---|---|---|
| Market Capital | 19,473.27 Crore | Market valuation of Bata India’s shares. |
| Revenue (TTM) | 3,478.6 Crore | Total revenue generated by Bata India over the past twelve months. |
| Net Income (TTM) | +262.51 Crore | Net Profit or Loss after all the expenses over the past twelve months. |
| Operating Margin | 11.59% | Income from operations as a percentage of revenue, before taxes and interest. |
| Profit Margin | 7.54% | Net income as a percentage of revenue, after all expenses. |
| Revenue Growth (Quarterly) | +2.5% | Change in revenue compared to the previous quarter. |
| Earnings Growth (YOY Quarterly) | -3% | Change in earnings compared to the same quarter last year. |
| Debt-to-Equity (D/E) Ratio | 88.89 | Company’s total debt divided by total shareholder equity. |
| Total Debt | 1,357.29 Crore | Sum of Bata India’s current & long-term financial obligations. |
| Total Cash | 404.1 Crore | Total amount of liquid funds available to Bata India. |
| Beta | 0.54 | Beta is less than 1 indicating that the Bata India’s price is less volatile than the market. |
Top Stocks That Created a New All Time High Today
Top Large Cap Stocks That Created a New All Time High Today
Companies with Market Capital more than 20,000 Crores| Stock | Close | New All-Time High (ATH) | Previous ATH | Previous ATH Date |
|---|---|---|---|---|
| Aurobindo Pharma | 1440.90 (-2.6%) | 1488.00 (+%) | Thu 01 Jan 1970 | |
| CDSL | 2566.00 (+4.59%) | 2594.85 (+22.47%) | 2118.60 | Tue 23 Apr 2024 |
| Colgate Palmolive | 3459.69 (-0.22%) | 3490.19 (+23.99%) | 2814.89 | Wed 03 Apr 2024 |
| Coromandel International | 1702.00 (+3.69%) | 1703.94 (+%) | Thu 01 Jan 1970 | |
| Glenmark Pharma | 1473.00 (+1.37%) | 1484.00 (+%) | Thu 01 Jan 1970 |
Top Mid Cap Stocks That Created a New All Time High Today
Companies with Market Capital between 5,000 Crores to 20,000 Crores| Stock | Close | New All-Time High (ATH) | Previous ATH | Previous ATH Date |
|---|---|---|---|---|
| Bombay Burmah Trading Corp | 2363.35 (+5.75%) | 2412.00 (+%) | Thu 01 Jan 1970 | |
| Bikaji Foods | 815.45 (+2.08%) | 879.00 (+%) | Thu 01 Jan 1970 | |
| Cera Sanitaryware | 10420.45 (+0.41%) | 10789.95 (+%) | Thu 01 Jan 1970 | |
| Epigral | 1945.00 (+1.88%) | 1964.00 (+37.83%) | 1424.90 | Mon 22 Apr 2024 |
| Eris Lifesciences | 1199.94 (+3.01%) | 1209.75 (+%) | Thu 01 Jan 1970 |
Top Small Cap Stocks That Created a New All Time High Today
Companies with Market Capital less than 5,000 Crores| Stock | Close | New All-Time High (ATH) | Previous ATH | Previous ATH Date |
|---|---|---|---|---|
| 20 Microns | 326.89 (+8.56%) | 331.50 (+%) | Thu 01 Jan 1970 | |
| 21ST CENTURY MANAG | 95.26 (+1.99%) | 95.26 (+%) | Thu 01 Jan 1970 | |
| 3P LAND HOLDINGS L | 50.31 (+7.4%) | 56.15 (+%) | Thu 01 Jan 1970 | |
| Ace Software Exports | 359.54 (+2%) | 359.54 (+139.24%) | 150.28 | Mon 01 Apr 2024 |
| Anna Infrastructures | 49.45 (+4.98%) | 49.45 (+%) | Thu 01 Jan 1970 |