Home / Wed 19 Jun 2024 Market Recap
19 Jun 2024: Nifty closed at ₹23,521.4 (-0.16%), with HDFC BANK & Maruti Suzuki leading the pack. Check out the top gainers & losers, & stocks to watch!
Show Table of Contents
Table of Contents
- 1: Top Indices Performance Overview
- 2: Nifty 50 Performance Overview
- 2.1: Nifty 50 Top Gainers
- 2.2: Nifty 50 Top Losers
- 2.3: Nifty 50 Stocks To Watch for Tomorrow
- 2.3.1: ➲ HDFC BANK (Looking Strong)
- 2.3.2: ➲ Maruti Suzuki (Bearish Pattern)
- 3: Nifty 500 Performance Overview
- 3.1: Nifty 500 Top Gainers
- 3.2: Nifty 500 Top Losers
- 3.3: Nifty 51 to 500 Stocks To Watch for Tomorrow
- 3.3.1: Carborundum: A Look at the Recent Bullish Trend
- 3.3.2: Finolex Industries/Pipe (Bearish Pattern)
- 4: Top Stocks That Created a New All Time High Today
- 4.1: Top Large Cap Stocks That Created a New All Time High Today
- 4.2: Top Mid Cap Stocks That Created a New All Time High Today
- 4.3: Top Small Cap Stocks That Created a New All Time High Today
Top Indices Performance Overview
| Stock | Close | Range |
|---|---|---|
| NIFTY 50 | ₹23,521.4 (-0.16%) | ₹23,413.19 – ₹23,663.59 |
| NIFTY BANK | ₹51,450.1 (2%) | ₹50,451.3 – ₹51,955.55 |
| NIFTY FIN SERVICE | ₹22,950.65 (1.61%) | ₹22,589.55 – ₹23,153.84 |
| NIFTY IT | ₹34,890.89 (0.25%) | ₹34,604.39 – ₹35,034.19 |
| NIFTY AUTO | ₹25,372.15 (-1.34%) | ₹25,345.9 – ₹25,822.15 |
| NIFTY ENERGY | ₹40,627.55 (-1.65%) | ₹40,558.25 – ₹41,455.94 |
Nifty 50 Performance Overview
The Nifty 50 started the day at ₹23,625.25, displaying a bit of a roller coaster ride throughout the session. It dipped to a low of ₹23,413.19 before climbing back up to a high of ₹23,663.59. By the closing bell, the index settled at ₹23,521.4 (-0.16%), ending the day with a slight decline.
Let’s take a look at the top gainers and losers that contributed to this movement in the Nifty 50.
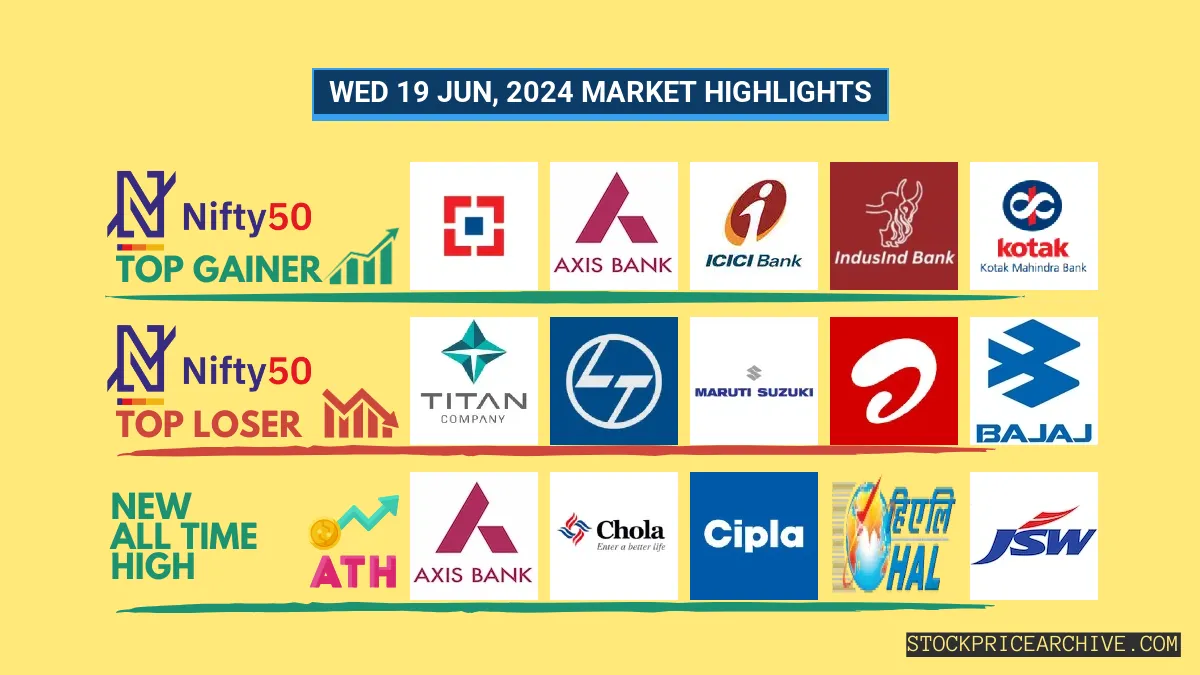
Nifty 50 Top Gainers
| Stock | Close | Range |
|---|---|---|
| HDFC BANK | ₹1,657.5 (3.09%) | ₹1,605.8 – ₹1,669.9 |
| Axis Bank | ₹1,226.65 (2.91%) | ₹1187 – ₹1,243.3 |
| ICICI BANK | ₹1,144.44 (1.92%) | ₹1,126.19 – ₹1,165.33 |
| IndusInd Bank | ₹1536 (1.86%) | ₹1,513.34 – ₹1,549.94 |
| Kotak Mahindra Bank | ₹1745 (1.48%) | ₹1,718.05 – ₹1,763.05 |
Nifty 50 Top Losers
| Stock | Close | Range |
|---|---|---|
| TITAN | ₹3,459.75 (-3.61%) | ₹3456 – ₹3,588.69 |
| Larsen Toubro | ₹3,589.94 (-2.7%) | ₹3575 – ₹3699 |
| Maruti Suzuki | ₹12,242.09 (-2.54%) | ₹12200 – ₹12625 |
| Bharti Airtel | ₹1393 (-2.48%) | ₹1,388.4 – ₹1,432.3 |
| Bajaj Auto | ₹9675 (-2.46%) | ₹9,671.54 – ₹9,947.7 |
Nifty 50 Stocks To Watch for Tomorrow
➲ HDFC BANK (Looking Strong)
- Performance Overview: Over the past 26 trading days, HDFC BANK has closed higher 21 times and lower 5 times. That’s a pretty impressive showing!
- Recent Trend: HDFC BANK has been on a roll, with a 6-day winning streak since Monday, June 10, 2024. It’s been a great period for investors!
- Returns: HDFC BANK delivered a 13.87% return during this period. This means if you invested ₹10,000, it would now be worth ₹11,387.
- Financial Insight: HDFC BANK has been a financial powerhouse. In the past 12 months, it generated a revenue of ₹2,28,837.94 Crore and achieved a profit of ₹64,062.04 Crore.
- As of Wednesday, June 19, 2024, HDFC BANK has a Market Capital of ₹12,14,544.71 Crore.
- Summary: HDFC BANK is looking strong with a positive trend. If you’re interested in exploring its potential, take a look at these resources: HDFC BANK Target for Tomorrow and HDFC BANK Targets for 2024 & 2025.
HDFC BANK Financial Performance
| Metric | Value | Description |
|---|---|---|
| Market Capital | 12,14,544.71 Crore | Market valuation of HDFC BANK’s shares. |
| Revenue (TTM) | 2,28,837.94 Crore | Total revenue generated by HDFC BANK over the past twelve months. |
| Net Income (TTM) | +64,062.04 Crore | Net Profit or Loss after all the expenses over the past twelve months. |
| Operating Margin | 26.55% | Income from operations as a percentage of revenue, before taxes and interest. |
| Profit Margin | 27.99% | Net income as a percentage of revenue, after all expenses. |
| Revenue Growth (Quarterly) | +113.19% | Change in revenue compared to the previous quarter. |
| Earnings Growth (YOY Quarterly) | +39.9% | Change in earnings compared to the same quarter last year. |
| Debt-to-Equity (D/E) Ratio | 1.62 | Company’s total debt divided by total shareholder equity. |
| Total Debt | 7,30,615.46 Crore | Sum of HDFC BANK’s current & long-term financial obligations. |
| Total Cash | 2,28,834.51 Crore | Total amount of liquid funds available to HDFC BANK. |
| Beta | 0.81 | Beta is less than 1 indicating that the HDFC BANK’s price is less volatile than the market. |
➲ Maruti Suzuki (Bearish Pattern)
- Performance Overview: In the last 26 trading sessions (from June 11th to June 19th, 2024), Maruti Suzuki has closed in the red 16 times and in the green 10 times.
- Recent Trend: Maruti Suzuki has been on a 5-day red streak, without a single day closing in the green since Tue 11 Jun 2024.
- Returns: Maruti Suzuki delivered a -3.67% return over the past 26 trading sessions. This means that an investment of ₹10,000 would have become ₹9,633 during this period.
- Financial Insight: Over the past 12 months, HDFC BANK has generated a revenue of ₹1,41,858.2 Crore and created a profit of ₹13,488.2 Crore.
- As of Wed 19 Jun 2024, HDFC BANK has a Market Capital of ₹4,03,856.94 Crore.
- Summary: Maruti Suzuki is currently in a bearish phase. We encourage investors to keep a close eye on its performance, particularly Maruti Suzuki Target for Tomorrow and Maruti Suzuki Targets for 2024 & 2025.
Maruti Suzuki Financial Performance
| Metric | Value | Description |
|---|---|---|
| Market Capital | 4,03,856.94 Crore | Market valuation of Maruti Suzuki’s shares. |
| Revenue (TTM) | 1,41,858.2 Crore | Total revenue generated by Maruti Suzuki over the past twelve months. |
| Net Income (TTM) | +13,488.2 Crore | Net Profit or Loss after all the expenses over the past twelve months. |
| Operating Margin | 10.19% | Income from operations as a percentage of revenue, before taxes and interest. |
| Profit Margin | 9.5% | Net income as a percentage of revenue, after all expenses. |
| Revenue Growth (Quarterly) | +20% | Change in revenue compared to the previous quarter. |
| Earnings Growth (YOY Quarterly) | +48% | Change in earnings compared to the same quarter last year. |
| Debt-to-Equity (D/E) Ratio | 0.13 | Company’s total debt divided by total shareholder equity. |
| Total Debt | 118.6 Crore | Sum of Maruti Suzuki’s current & long-term financial obligations. |
| Total Cash | 6,735.3 Crore | Total amount of liquid funds available to Maruti Suzuki. |
| Beta | 0.59 | Beta is less than 1 indicating that the Maruti Suzuki’s price is less volatile than the market. |
Nifty 500 Performance Overview
The Nifty 500 started the day at ₹22,403.09, showcasing a bit of a roller coaster ride. It dipped to a low of ₹22,127.30 before climbing back up to a high of ₹22,405.80. At the end of the trading session, the index settled at ₹22,227.75, representing a -0.46% decline.
Let’s take a look at the top gainers and losers that influenced the Nifty 500’s movement today.
Nifty 500 Top Gainers
| Stock | Close | Range |
|---|---|---|
| Delta Corp | ₹147.25 (11.34%) | ₹136.63 – ₹154.85 |
| E.I.D. Parry | ₹814.9 (11.12%) | ₹733.75 – ₹833 |
| Jubilant Ingrevia | ₹558 (8.33%) | ₹513 – ₹561 |
| Alok industries | ₹29.58 (8.03%) | ₹26.9 – ₹29.99 |
| Triveni Engineering & Industries | ₹415.29 (7.92%) | ₹375.29 – ₹427 |
Nifty 500 Top Losers
| Stock | Close | Range |
|---|---|---|
| zfcvindia | ₹16,099.95 (-6.82%) | ₹15,770.4 – ₹16,740.15 |
| Sobha | ₹2,024.65 (-6.26%) | ₹2,009.65 – ₹2,094.75 |
| KEI Industries | ₹4,429.89 (-5.56%) | ₹4425 – ₹4700 |
| Mazagoan Dock Shipbuilders | ₹3970 (-4.99%) | ₹3950 – ₹4245 |
| Endurance Technologies | ₹2602 (-4.68%) | ₹2,578.1 – ₹2,750.1 |
Nifty 51 to 500 Stocks To Watch for Tomorrow
Carborundum: A Look at the Recent Bullish Trend
- Performance Overview: Over the last 26 trading sessions, Carborundum has closed higher than the previous day 17 times, indicating a strong upward trend.
- Recent Trend: Carborundum has been on a roll! The stock has closed higher for the past 10 trading days, with no red days since Tuesday, June 4, 2024.
- Returns: If you had invested ₹10,000 in Carborundum 26 trading sessions ago, your investment would have grown to ₹11,959, representing a 19.59% return!
- Financial Insight: Carborundum is performing well financially. Over the past 12 months, the company generated a revenue of ₹4,702.18 Crore and a profit of ₹461.24 Crore.
- As of Wednesday, June 19, 2024, Carborundum has a Market Capital of ₹33,751.77 Crore.
- Summary: Carborundum is displaying a strong bullish pattern. Investors may want to keep an eye on the stock’s price movements to capitalize on both short-term and long-term growth opportunities. Check out these resources for target price predictions: Carborundum Target for Tomorrow and Carborundum Targets for 2024 & 2025.
Carborundum Financial Performance
| Metric | Value | Description |
|---|---|---|
| Market Capital | 33,751.77 Crore | Market valuation of Carborundum’s shares. |
| Revenue (TTM) | 4,702.18 Crore | Total revenue generated by Carborundum over the past twelve months. |
| Net Income (TTM) | +461.24 Crore | Net Profit or Loss after all the expenses over the past twelve months. |
| Operating Margin | 13.19% | Income from operations as a percentage of revenue, before taxes and interest. |
| Profit Margin | 9.8% | Net income as a percentage of revenue, after all expenses. |
| Revenue Growth (Quarterly) | +0.1% | Change in revenue compared to the previous quarter. |
| Earnings Growth (YOY Quarterly) | -1.71% | Change in earnings compared to the same quarter last year. |
| Debt-to-Equity (D/E) Ratio | 5.26 | Company’s total debt divided by total shareholder equity. |
| Total Debt | 171.88 Crore | Sum of Carborundum’s current & long-term financial obligations. |
| Total Cash | 557.92 Crore | Total amount of liquid funds available to Carborundum. |
| Beta | 0.68 | Beta is less than 1 indicating that the Carborundum’s price is less volatile than the market. |
Finolex Industries/Pipe (Bearish Pattern)
- Performance Overview: Over the past 26 trading sessions, Finolex Industries/Pipe has closed higher than the previous day 13 times and lower 13 times. This suggests a period of volatility.
- Recent Trend: Finolex Industries/Pipe has been on a 7-day downward streak, closing lower each day since Friday, June 7, 2024.
- Returns: Despite the recent downward trend, Finolex Industries/Pipe has still yielded a 20.88% return over the past 26 trading sessions. This means that an investment of ₹10,000 would have grown to ₹12,088.
- Financial Insight: Over the past year, Finolex Industries/Pipe has generated revenue of ₹4,317.43 Crore and earned a profit of ₹473.59 Crore.
- As of Wednesday, June 19, 2024, Finolex Industries/Pipe has a Market Capital of ₹20,528.92 Crore.
- Summary: Finolex Industries/Pipe is currently in a bearish phase. Investors are advised to closely monitor the stock’s performance, especially with respect to Finolex Industries/Pipe Target for Tomorrow and Finolex Industries/Pipe Targets for 2024 & 2025.
Finolex Industries/Pipe Financial Performance
| Metric | Value | Description |
|---|---|---|
| Market Capital | 20,528.92 Crore | Market valuation of Finolex Industries/Pipe’s shares. |
| Revenue (TTM) | 4,317.43 Crore | Total revenue generated by Finolex Industries/Pipe over the past twelve months. |
| Net Income (TTM) | +473.59 Crore | Net Profit or Loss after all the expenses over the past twelve months. |
| Operating Margin | 14.75% | Income from operations as a percentage of revenue, before taxes and interest. |
| Profit Margin | 10.96% | Net income as a percentage of revenue, after all expenses. |
| Revenue Growth (Quarterly) | +8.3% | Change in revenue compared to the previous quarter. |
| Earnings Growth (YOY Quarterly) | -1.4% | Change in earnings compared to the same quarter last year. |
| Debt-to-Equity (D/E) Ratio | 6.99 | Company’s total debt divided by total shareholder equity. |
| Total Debt | 393.95 Crore | Sum of Finolex Industries/Pipe’s current & long-term financial obligations. |
| Total Cash | 1,936.79 Crore | Total amount of liquid funds available to Finolex Industries/Pipe. |
| Beta | 0.73 | Beta is less than 1 indicating that the Finolex Industries/Pipe’s price is less volatile than the market. |
Top Stocks That Created a New All Time High Today
Top Large Cap Stocks That Created a New All Time High Today
Companies with Market Capital more than 20,000 Crores| Stock | Close | New All-Time High (ATH) | Previous ATH | Previous ATH Date |
|---|---|---|---|---|
| Axis Bank | 1226.65 (+2.91%) | 1243.30 (+%) | Thu 01 Jan 1970 | |
| Balkrishna Industries | 3278.19 (-2.02%) | 3362.69 (+%) | Thu 01 Jan 1970 | |
| Carborundum | 1825.00 (+2.35%) | 1825.00 (+34.23%) | 1359.59 | Wed 03 Apr 2024 |
| Cholamandalam | 1450.69 (-0.24%) | 1476.00 (+%) | Thu 01 Jan 1970 | |
| Cholamandalam Financial | 1292.00 (+0.23%) | 1313.34 (+%) | Thu 01 Jan 1970 |
Top Mid Cap Stocks That Created a New All Time High Today
Companies with Market Capital between 5,000 Crores to 20,000 Crores| Stock | Close | New All-Time High (ATH) | Previous ATH | Previous ATH Date |
|---|---|---|---|---|
| Aarti Pharmalabs | 637.50 (-0.97%) | 652.75 (+%) | Thu 01 Jan 1970 | |
| Aurionpro Solutions | 2960.60 (+4.98%) | 2960.89 (+10.29%) | 2684.45 | Mon 01 Apr 2024 |
| Azad Engineering | 1981.80 (+4.99%) | 1981.80 (+%) | Thu 01 Jan 1970 | |
| E.I.D. Parry | 814.90 (+11.12%) | 833.00 (+%) | Thu 01 Jan 1970 | |
| Eris Lifesciences | 1038.05 (-1%) | 1065.80 (+%) | Thu 01 Jan 1970 |
Top Small Cap Stocks That Created a New All Time High Today
Companies with Market Capital less than 5,000 Crores| Stock | Close | New All-Time High (ATH) | Previous ATH | Previous ATH Date |
|---|---|---|---|---|
| Aayush Food and Herbs | 281.29 (+0.48%) | 290.00 (+19.66%) | 242.35 | Thu 25 Apr 2024 |
| ACGL | 2465.10 (+0.14%) | 2510.00 (+%) | Thu 01 Jan 1970 | |
| Abans Holdings | 484.70 (+1.18%) | 493.75 (+13.34%) | 435.60 | Wed 10 Apr 2024 |
| Ahmedabad Steelcraft | 89.91 (+1.99%) | 89.91 (+%) | Thu 01 Jan 1970 | |
| AMBIT | 7.90 (+4.91%) | 7.90 (+%) | Thu 01 Jan 1970 |