Home / Wed 12 Jun 2024 Market Recap
12 Jun 2024: Nifty closed at ₹23,322.94 (+0.24%), with Apollo Hospitals & V-Mart soaring!Discover top gainers, losers, & stocks to watch for tomorrow!
Show Table of Contents
Table of Contents
- 1: Top Indices Performance Overview
- 2: Nifty 50 Performance Overview
- 2.1: Nifty 50 Top Gainers
- 2.2: Nifty 50 Top Losers
- 2.3: Nifty 50 Stocks To Watch for Tomorrow
- 2.3.1: ➲ Apollo Hospitals (Bullish Pattern)
- 2.3.2: ➲ Hindustan Unilever (Bearish Pattern)
- 3: Nifty 500 Performance Overview
- 3.1: Nifty 500 Top Gainers
- 3.2: Nifty 500 Top Losers
- 3.3: Nifty 51 to 500 Stocks To Watch for Tomorrow
- 3.3.1: ➲ V-Mart (Bullish Pattern)
- 3.3.2: ➲ Allcargo Logistics (Bearish Pattern)
- 4: Top Stocks That Created a New All Time High Today
- 4.1: Top Large Cap Stocks That Created a New All Time High Today
- 4.2: Top Mid Cap Stocks That Created a New All Time High Today
- 4.3: Top Small Cap Stocks That Created a New All Time High Today
Top Indices Performance Overview
| Stock | Close | Range |
|---|---|---|
| NIFTY 50 | ₹23,322.94 (0.24%) | ₹23,295.94 – ₹23,441.94 |
| NIFTY BANK | ₹49,895.1 (0.38%) | ₹49,697.35 – ₹50,233.39 |
| NIFTY FIN SERVICE | ₹22,232.4 (0.48%) | ₹22,135.5 – ₹22,376.75 |
| NIFTY IT | ₹34,563.85 (0.09%) | ₹34,506.3 – ₹35,013.89 |
| NIFTY AUTO | ₹25,230.94 (0%) | ₹25,198.09 – ₹25,406.69 |
| NIFTY ENERGY | ₹40,998.19 (0.92%) | ₹40,707.8 – ₹41,266.05 |
Nifty 50 Performance Overview
The Nifty 50 opened trading at ₹23,344.44. During the session, it fluctuated between a low of ₹23,295.94 and a high of ₹23,441.94. The index finally closed at ₹23,322.94, up 0.24% from its opening price.Nifty 50 Top Gainers
| Stock | Close | Range |
|---|---|---|
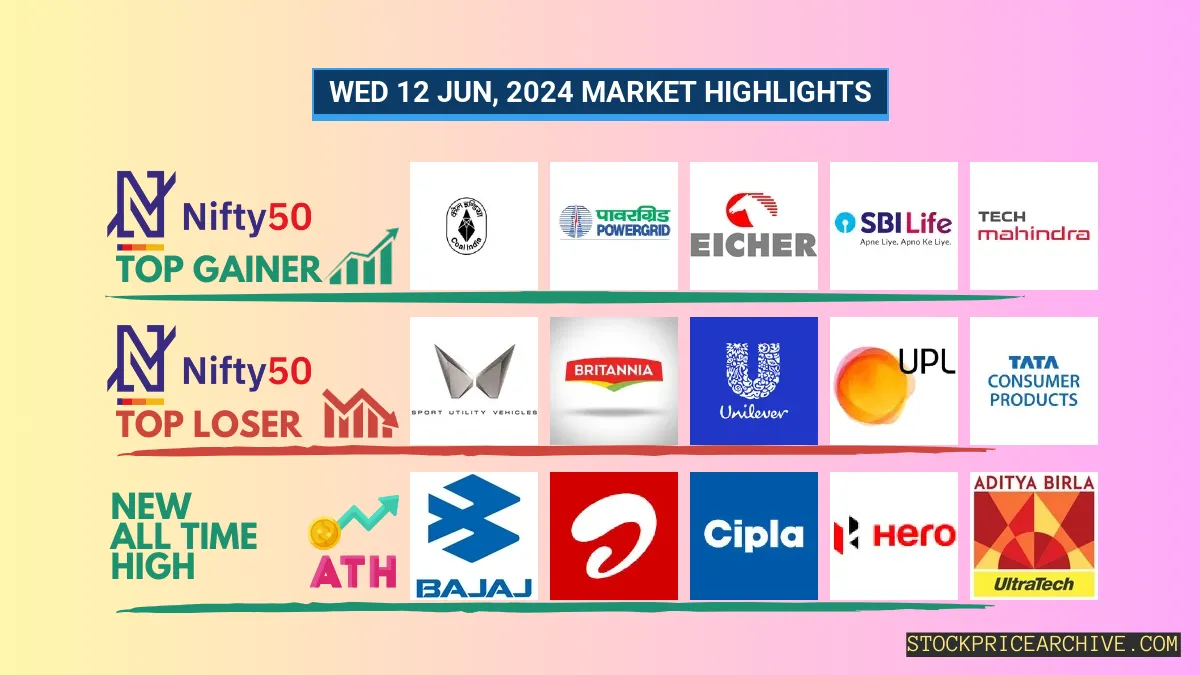
| Coal India | ₹489.7 (2.8%) | ₹480.2 – ₹494.2 |
| Power Grid | ₹324.64 (2.55%) | ₹316.89 – ₹327.1 |
| Eicher Motors | ₹4845 (1.81%) | ₹4,745.95 – ₹4872 |
| SBI Life Insurance | ₹1,452.69 (1.72%) | ₹1,425.8 – ₹1,461.8 |
| Tech Mahindra | ₹1,371.65 (1.64%) | ₹1,357.15 – ₹1381 |
Nifty 50 Top Losers
| Stock | Close | Range |
|---|---|---|
| Mahindra & Mahindra | ₹2,787.55 (-1.7%) | ₹2,782.05 – ₹2,848.6 |
| Britannia | ₹5,448.89 (-1.25%) | ₹5,431.04 – ₹5564 |
| Hindustan Unilever | ₹2,531.5 (-0.98%) | ₹2,517.55 – ₹2,562.75 |
| UPL | ₹549.09 (-0.94%) | ₹548.5 – ₹558.59 |
| Tata Consumer Products | ₹1,125.25 (-0.92%) | ₹1,123.5 – ₹1142 |
Nifty 50 Stocks To Watch for Tomorrow
➲ Apollo Hospitals (Bullish Pattern)
- Price Performance: Apollo Hospitals has recorded gains in 15 of the past 27 trading sessions. This positive performance equates to a 1.31% return on investment. A hypothetical investment of ₹10,000 would now be worth ₹10,131.
- Recent Trend: The stock has been on a 6-day green streak, with no red days since Tuesday, June 4, 2024.
- Financial Strength: In the last 12 months, Apollo Hospitals has achieved a revenue of ₹19,059.19 Crore . The company’s profit during this period amounted to ₹898.6 Crore.
- Market Metrics: As of Wednesday, June 12, 2024, Apollo Hospitals has a Market Capital of ₹86,303.34 Crore.
- Investment Outlook: Apollo Hospitals presents a compelling bullish trend, signaling potential growth opportunities for investors. Interested individuals can further explore the company’s performance through our short-term targets and long-term targets for 2024 & 2025.
Apollo Hospitals Financial Performance
| Metric | Value | Description |
|---|---|---|
| Market Capital | 86,303.34 Crore | Market valuation of Apollo Hospitals’s shares. |
| Revenue (TTM) | 19,059.19 Crore | Total revenue generated by Apollo Hospitals over the past twelve months. |
| Net Income (TTM) | +898.6 Crore | Net Profit or Loss after all the expenses over the past twelve months. |
| Operating Margin | 9.11% | Income from operations as a percentage of revenue, before taxes and interest. |
| Profit Margin | 4.71% | Net income as a percentage of revenue, after all expenses. |
| Revenue Growth (Quarterly) | +14.89% | Change in revenue compared to the previous quarter. |
| Earnings Growth (YOY Quarterly) | +75.59% | Change in earnings compared to the same quarter last year. |
| Debt-to-Equity (D/E) Ratio | 72.84 | Company’s total debt divided by total shareholder equity. |
| Total Debt | 5,332.6 Crore | Sum of Apollo Hospitals’s current & long-term financial obligations. |
| Total Cash | 1,617.79 Crore | Total amount of liquid funds available to Apollo Hospitals. |
| Beta | 0.56 | Beta is less than 1 indicating that the Apollo Hospitals’s price is less volatile than the market. |
➲ Hindustan Unilever (Bearish Pattern)
- Performance Overview: In the past 27 trading sessions, Hindustan Unilever has closed in the red for 15 sessions and closed in the green for 12.
- Recent Trend: Hindustan Unilever has been on a 3-day red streak, without a single day closing in the green since Friday, June 7th, 2024.
- Returns: Hindustan Unilever has provided a return of 11.71% over the past 27 trading sessions, which means an investment of ₹10,000 would have grown to ₹11,171.
- Financial Insight: Over the past 12 months, Hindustan Unilever has generated a revenue of ₹61,895.99 Crore and a profit of ₹10,276.99 Crore.
- As of Wednesday, June 12th, 2024, Hindustan Unilever has a Market Capital of ₹6,05,700.54 Crore.
- Summary: Hindustan Unilever is currently experiencing a bearish trend. Investors should be cautious and closely monitor the stock’s movement, particularly its Tomorrow’s Target and Targets for 2024 & 2025.
Hindustan Unilever Financial Performance
| Metric | Value | Description |
|---|---|---|
| Market Capital | 6,05,700.54 Crore | Market valuation of Hindustan Unilever’s shares. |
| Revenue (TTM) | 61,895.99 Crore | Total revenue generated by Hindustan Unilever over the past twelve months. |
| Net Income (TTM) | +10,276.99 Crore | Net Profit or Loss after all the expenses over the past twelve months. |
| Operating Margin | 20.92% | Income from operations as a percentage of revenue, before taxes and interest. |
| Profit Margin | 16.6% | Net income as a percentage of revenue, after all expenses. |
| Revenue Growth (Quarterly) | -1.66% | Change in revenue compared to the previous quarter. |
| Earnings Growth (YOY Quarterly) | -1.6% | Change in earnings compared to the same quarter last year. |
| Debt-to-Equity (D/E) Ratio | 2.88 | Company’s total debt divided by total shareholder equity. |
| Total Debt | 1,484 Crore | Sum of Hindustan Unilever’s current & long-term financial obligations. |
| Total Cash | 11,888.99 Crore | Total amount of liquid funds available to Hindustan Unilever. |
| Beta | 0.07 | Beta is less than 1 indicating that the Hindustan Unilever’s price is less volatile than the market. |
Nifty 500 Performance Overview
The Nifty 500 commenced the day at ₹21,934.34. During the trading session, it witnessed fluctuations, recording a low of ₹21,905.19 and a high of ₹22,023.59. Finally, it concluded at ₹21,952.94, reflecting a 0.46% gain.
Refer to the provided table to discover the notable gainers and losers that impacted today’s Nifty 500 performance.
Nifty 500 Top Gainers
| Stock | Close | Range |
|---|---|---|
| Sunteck Realty | ₹576.34 (9.07%) | ₹526.15 – ₹586 |
| Max Healthcare | ₹870.5 (8.47%) | ₹807.5 – ₹877.79 |
| Trident | ₹40.93 (8.16%) | ₹38.1 – ₹40.96 |
| Aptus Value Housing Finance | ₹341.45 (6.73%) | ₹319.64 – ₹341.95 |
| Tata Teleservices | ₹81.19 (6.47%) | ₹76.25 – ₹82.5 |
Nifty 500 Top Losers
| Stock | Close | Range |
|---|---|---|
| Brightcom Group | ₹9.88 (-5.1%) | ₹9.88 – ₹9.88 |
| Brigade Enterprises | ₹1342 (-4.11%) | ₹1339 – ₹1,411.84 |
| Sterling and Wilson Solar | ₹765 (-3.86%) | ₹762.29 – ₹810.79 |
| Apollo Tubes | ₹1,581.69 (-3.13%) | ₹1,577.15 – ₹1654 |
| Pidilite Industries | ₹3,078.5 (-3.06%) | ₹3,071.55 – ₹3184 |
Nifty 51 to 500 Stocks To Watch for Tomorrow
➲ V-Mart (Bullish Pattern)
- Performance Overview: In the last 27 trading sessions, V-Mart has closed in green 15 times and in red 12 times, indicating an upward trend.
- Recent Trend: V-Mart has been on a 8-day green streak, without a single negative day since Friday, May 31, 2024. This consistent upward movement suggests bullish momentum.
- Returns: V-Mart has delivered impressive returns over the past 27 trading sessions, delivering 33.34% to investors. This means that if you had invested ₹10,000, it would have grown to approximately ₹13,334.
- Financial Performance: Over the past year, V-Mart has shown strong financial performance with a revenue of ₹2,806.54 Crore and a profit of ₹96.76 Crore. This indicates strong fundamental strength and the company’s potential for growth.
- As of Wednesday, June 12, 2024, V-Mart has a Market Capital of ₹4,490.33 Crore.
- Bullish Pattern: V-Mart exhibits a clear bullish pattern, with a series of higher highs and higher lows. This pattern suggests that investors should monitor its price movements closely for both short-term and long-term growth prospects. Checkout V-Mart Target for Tomorrow and V-Mart Targets for 2024 & 2025.
V-Mart Financial Performance
| Metric | Value | Description |
|---|---|---|
| Market Capital | 4,490.33 Crore | Market valuation of V-Mart’s shares. |
| Revenue (TTM) | 2,806.54 Crore | Total revenue generated by V-Mart over the past twelve months. |
| Net Income (TTM) | -96.76 Crore | Net Profit or Loss after all the expenses over the past twelve months. |
| Operating Margin | -3.07% | Income from operations as a percentage of revenue, before taxes and interest. |
| Profit Margin | -3.45% | Net income as a percentage of revenue, after all expenses. |
| Revenue Growth (Quarterly) | +12.6% | Change in revenue compared to the previous quarter. |
| Earnings Growth (YOY Quarterly) | +12.57% | Change in earnings compared to the same quarter last year. |
| Debt-to-Equity (D/E) Ratio | 186.24 | Company’s total debt divided by total shareholder equity. |
| Total Debt | 1,391.25 Crore | Sum of V-Mart’s current & long-term financial obligations. |
| Total Cash | 31.93 Crore | Total amount of liquid funds available to V-Mart. |
| Beta | 0.58 | Beta is less than 1 indicating that the V-Mart’s price is less volatile than the market. |
➲ Allcargo Logistics (Bearish Pattern)
- Performance Overview: In the past 26 trading sessions, Allcargo Logistics has closed in red 15 times and in green 11 times. It’s important to note that the stock has been on a 4-day red streak, with the last green close being on Thu 06 Jun 2024.
- Returns: Over the last 26 trading sessions, Allcargo Logistics has given a -7.88% return, meaning an investment of ₹10,000 would now be worth approximately ₹9,212.
- Financial Snapshot: In the past 12 months, Allcargo Logistics has generated a revenue of ₹13,187.82 Crore and a profit of ₹149.69 Crore. As of Wed 12 Jun 2024, it has a Market Capitalization of ₹6,555.15 Crore.
- Summary: Allcargo Logistics is currently experiencing a bearish trend. Investors should closely monitor the stock, particularly its performance against its Tomorrow’s Target and 2024 & 2025 Targets.
Allcargo Logistics Financial Performance
| Metric | Value | Description |
|---|---|---|
| Market Capital | 6,555.15 Crore | Market valuation of Allcargo Logistics’s shares. |
| Revenue (TTM) | 13,187.82 Crore | Total revenue generated by Allcargo Logistics over the past twelve months. |
| Net Income (TTM) | +149.69 Crore | Net Profit or Loss after all the expenses over the past twelve months. |
| Operating Margin | 5.6% | Income from operations as a percentage of revenue, before taxes and interest. |
| Profit Margin | 1.13% | Net income as a percentage of revenue, after all expenses. |
| Revenue Growth (Quarterly) | +111.9% | Change in revenue compared to the previous quarter. |
| Earnings Growth (YOY Quarterly) | +298.3% | Change in earnings compared to the same quarter last year. |
| Debt-to-Equity (D/E) Ratio | 0.7 | Company’s total debt divided by total shareholder equity. |
| Total Debt | 1,846.14 Crore | Sum of Allcargo Logistics’s current & long-term financial obligations. |
| Beta | 0.84 | Beta is less than 1 indicating that the Allcargo Logistics’s price is less volatile than the market. |
Top Stocks That Created a New All Time High Today
Top Large Cap Stocks That Created a New All Time High Today
Companies with Market Capital more than 20,000 Crores| Stock | Close | New All-Time High (ATH) | Previous ATH | Previous ATH Date |
|---|---|---|---|---|
| Ashok Leyland | 237.71 (-0.11%) | 241.50 (+%) | Thu 01 Jan 1970 | |
| Bajaj Auto | 9904.25 (+0.93%) | 9944.00 (+%) | Thu 01 Jan 1970 | |
| Bharti Airtel | 1437.40 (+0.71%) | 1447.84 (+7.16%) | 1351.00 | Tue 23 Apr 2024 |
| CEBBCO | 694.20 (+5.53%) | 708.65 (+63.35%) | 433.80 | Mon 01 Jan 2024 |
| Cholamandalam | 1356.34 (+1.8%) | 1369.15 (+%) | Thu 01 Jan 1970 |
Top Mid Cap Stocks That Created a New All Time High Today
Companies with Market Capital between 5,000 Crores to 20,000 Crores| Stock | Close | New All-Time High (ATH) | Previous ATH | Previous ATH Date |
|---|---|---|---|---|
| Azad Engineering | 1685.09 (-0.69%) | 1755.50 (+%) | Thu 01 Jan 1970 | |
| BASF | 4841.00 (+3.11%) | 4923.00 (+%) | Thu 01 Jan 1970 | |
| CMS Info Systems | 490.79 (+1.62%) | 494.79 (+%) | Thu 01 Jan 1970 | |
| Dhanuka Agritech | 1600.90 (-1.33%) | 1669.00 (+19.56%) | 1395.90 | Mon 22 Apr 2024 |
| ELANTAS Beck India | 11900.04 (+5.55%) | 12947.95 (+29.6%) | 9990.00 | Mon 01 Apr 2024 |
Top Small Cap Stocks That Created a New All Time High Today
Companies with Market Capital less than 5,000 Crores| Stock | Close | New All-Time High (ATH) | Previous ATH | Previous ATH Date |
|---|---|---|---|---|
| Ace Software Exports | 244.85 (+1.99%) | 244.85 (+62.92%) | 150.28 | Mon 01 Apr 2024 |
| Ahmedabad Steelcraft | 83.08 (+1.98%) | 83.08 (+%) | Thu 01 Jan 1970 | |
| Alicon Castalloy | 1241.94 (+11.01%) | 1241.94 (+%) | Thu 01 Jan 1970 | |
| Allsec Technologies | 1147.15 (+4.57%) | 1154.00 (+%) | Thu 01 Jan 1970 | |
| Automotive Stampings | 973.00 (+1.37%) | 1008.79 (+%) | Thu 01 Jan 1970 |


