Home / Wed 31 Jul 2024 Market Recap
31 Jul 2024: Nifty 50 Closes at ₹24,979.3 (+0.49%), Bharat Petroleum Closing Higher For Past 6-days & Eris Lifesciences For Past 8-days!
Show Table of Contents
Table of Contents
- 1: Top Indices Performance Overview
- 2: Nifty 50 Performance Overview
- 2.1: Nifty 50 Top Gainers
- 2.2: Nifty 50 Top Losers
- 2.3: Nifty 50 Stocks To Watch for Tomorrow
- 2.3.1: ➲ Bharat Petroleum (Looking Strong)
- 2.3.2: ➲ Tata Consumer Products (Recent Bearish Trend)
- 3: Nifty 500 Performance Overview
- 3.1: Nifty 500 Top Gainers
- 3.2: Nifty 500 Top Losers
- 3.3: Nifty 51 to 500 Stocks To Watch for Tomorrow
- 3.3.1: Eris Lifesciences: A Bullish Trend to Watch
- 3.3.2: ➲ Poly Medicure (Bearish Pattern)
- 4: Top Stocks That Created a New All Time High Today
- 4.1: Top Large Cap Stocks That Created a New All Time High Today
- 4.2: Top Mid Cap Stocks That Created a New All Time High Today
- 4.3: Top Small Cap Stocks That Created a New All Time High Today
Top Indices Performance Overview
| Stock | Close | Range |
|---|---|---|
| NIFTY 50 | ₹24,979.3 (0.49%) | ₹24,857.34 – ₹24,983.3 |
| NIFTY BANK | ₹51,621.94 (0.23%) | ₹51,335.69 – ₹51,663.1 |
| NIFTY IT | ₹40,863.35 (0.21%) | ₹40,658.05 – ₹41,074.05 |
| NIFTY ENERGY | ₹44,109.19 (0.45%) | ₹43,687.64 – ₹44,133.35 |
Nifty 50 Performance Overview
The Nifty 50 kicked off the day at ₹24,883. It saw some ups and downs throughout the trading session, touching a low of ₹24,857.34 and a high of ₹24,983.3 before closing at ₹24,979.3 (+0.49%). This positive movement was influenced by strong performances from some stocks, while others saw declines.
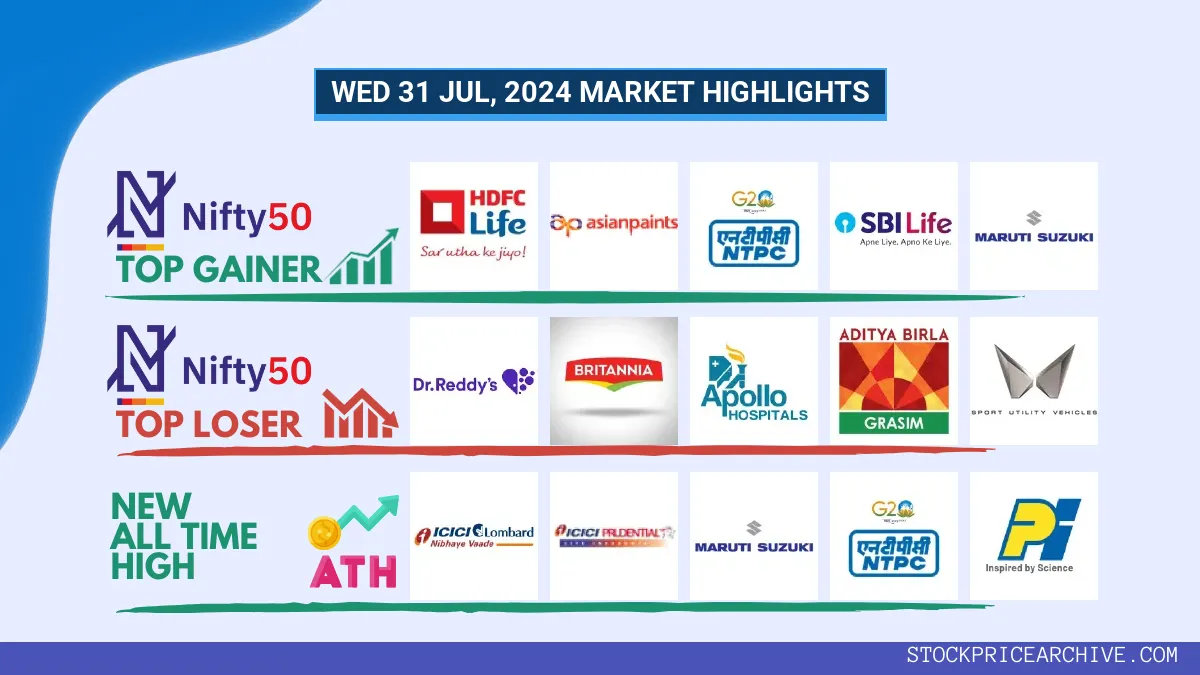
Nifty 50 Top Gainers
| Stock | Close | Range |
|---|---|---|
| HDFC Life | ₹716.75 (2.8%) | ₹693.2 – ₹719 |
| Asian Paints | ₹3087 (2.72%) | ₹3,008.39 – ₹3098 |
| NTPC | ₹415.85 (2.18%) | ₹409.39 – ₹417.39 |
| SBI Life Insurance | ₹1,753.65 (1.89%) | ₹1720 – ₹1760 |
| Maruti Suzuki | ₹13,115.79 (1.88%) | ₹12,895.15 – ₹13375 |
Nifty 50 Top Losers
| Stock | Close | Range |
|---|---|---|
| Dr Reddy Lab | ₹6,750.5 (-0.79%) | ₹6,736.89 – ₹6829 |
| Britannia | ₹5800 (-0.73%) | ₹5,770.29 – ₹5885 |
| Apollo Hospitals | ₹6,599.45 (-0.63%) | ₹6,584.2 – ₹6,686.5 |
| GRASIM | ₹2777 (-0.5%) | ₹2,763.8 – ₹2,798.64 |
| Mahindra & Mahindra | ₹2,907.8 (-0.49%) | ₹2,872.94 – ₹2,979.6 |
Nifty 50 Stocks To Watch for Tomorrow
➲ Bharat Petroleum (Looking Strong)
- Recent Performance: In the past 26 trading days, Bharat Petroleum has closed higher 18 times and lower 8 times. That’s a pretty good track record!
- Hot Streak: Bharat Petroleum has been on a roll, closing higher for six straight days since Tuesday, July 23, 2024.
- Returns: Over the last 26 trading sessions, Bharat Petroleum has delivered a 15% return. Imagine, if you invested ₹10,000, it would be worth ₹11,500 today!
- Financial Snapshot: Over the past year, Bharat Petroleum has generated a revenue of ₹4,50,427.87 Crore and made a profit of ₹19,056.08 Crore. That’s a strong showing!
- As of Wednesday, July 31, 2024, Bharat Petroleum has a Market Capital of ₹1,42,650.19 Crore.
- Summary: Bharat Petroleum’s recent performance is definitely encouraging. It’s displaying a strong upward trend. If you’re interested, you can check out our projections for both short-term and long-term growth: Checkout Bharat Petroleum Target for Tomorrow and Bharat Petroleum Targets for 2024 & 2025.
Bharat Petroleum Financial Performance
| Metric | Value | Description |
|---|---|---|
| Market Capital | 1,42,650.19 Crore | Market valuation of Bharat Petroleum’s shares. |
| Revenue (TTM) | 4,50,427.87 Crore | Total revenue generated by Bharat Petroleum over the past twelve months. |
| Net Income (TTM) | +19,056.08 Crore | Net Profit or Loss after all the expenses over the past twelve months. |
| Operating Margin | 3.48% | Income from operations as a percentage of revenue, before taxes and interest. |
| Profit Margin | 4.23% | Net income as a percentage of revenue, after all expenses. |
| Revenue Growth (Quarterly) | +0.1% | Change in revenue compared to the previous quarter. |
| Earnings Growth (YOY Quarterly) | -73.3% | Change in earnings compared to the same quarter last year. |
| Debt-to-Equity (D/E) Ratio | 72.18 | Company’s total debt divided by total shareholder equity. |
| Total Debt | 54,599.05 Crore | Sum of Bharat Petroleum’s current & long-term financial obligations. |
| Total Cash | 10,577.03 Crore | Total amount of liquid funds available to Bharat Petroleum. |
| Beta | 1.07 | Beta is greater than 1 indicating that the Bharat Petroleum’s price is more volatile than the market. |
➲ Tata Consumer Products (Recent Bearish Trend)
- Performance Snapshot: Over the past 26 trading days, Tata Consumer Products has closed lower than the previous day on 15 occasions and higher on 11.
- Recent Trend: The stock has been on a downward trend for the past 6 trading days, closing lower each day since Tuesday, July 23, 2024.
- Returns: While the stock has seen some fluctuations, it has yielded a positive return of 7.29% over the last 26 trading sessions. This means that a ₹10,000 investment would have grown to ₹10,729 during this period.
- Financial Highlights: In the past 12 months, Tata Consumer Products generated a revenue of ₹15,205.84 Crore and generated a profit of ₹1,150.32 Crore.
- As of Wednesday, July 31, 2024, Tata Consumer Products had a Market Capitalization of ₹1,06,484.01 Crore.
- Outlook: Tata Consumer Products is currently experiencing a bearish phase. We encourage investors to stay informed and monitor the stock’s performance closely. You may want to check out Tata Consumer Products’ Target for Tomorrow and Tata Consumer Products Targets for 2024 & 2025 for potential insights.
Tata Consumer Products Financial Performance
| Metric | Value | Description |
|---|---|---|
| Market Capital | 1,06,484.01 Crore | Market valuation of Tata Consumer Products’s shares. |
| Revenue (TTM) | 15,205.84 Crore | Total revenue generated by Tata Consumer Products over the past twelve months. |
| Net Income (TTM) | +1,150.32 Crore | Net Profit or Loss after all the expenses over the past twelve months. |
| Operating Margin | 12.85% | Income from operations as a percentage of revenue, before taxes and interest. |
| Profit Margin | 7.56% | Net income as a percentage of revenue, after all expenses. |
| Revenue Growth (Quarterly) | +8.5% | Change in revenue compared to the previous quarter. |
| Earnings Growth (YOY Quarterly) | -19.3% | Change in earnings compared to the same quarter last year. |
| Debt-to-Equity (D/E) Ratio | 19.94 | Company’s total debt divided by total shareholder equity. |
| Total Debt | 3,477.22 Crore | Sum of Tata Consumer Products’s current & long-term financial obligations. |
| Total Cash | 2,702.98 Crore | Total amount of liquid funds available to Tata Consumer Products. |
| Beta | 0.49 | Beta is less than 1 indicating that the Tata Consumer Products’s price is less volatile than the market. |
Nifty 500 Performance Overview
The Nifty 500 started the day at ₹23,498.09, showing some volatility throughout the trading session. It dipped to a low of ₹23,460.05 before rallying to a high of ₹23,555.9. The index closed the day strong, finishing at ₹23,550.09 (+0.46%).
This movement was influenced by the top gainers and losers, which you can see in the table below.
Nifty 500 Top Gainers
| Stock | Close | Range |
|---|---|---|
| Torrent Power | ₹1,866.44 (16.55%) | ₹1669 – ₹1908 |
| Granules India | ₹630.09 (6.98%) | ₹590.25 – ₹632.7 |
| Kfin Technologies | ₹874 (6.33%) | ₹827.45 – ₹898 |
| BSE | ₹2560 (6.12%) | ₹2,390.94 – ₹2,607.64 |
| Suven Pharmaceuticals | ₹995.15 (5.42%) | ₹947.5 – ₹1,070.58 |
Nifty 500 Top Losers
| Stock | Close | Range |
|---|---|---|
| Indiamart Intermesh | ₹2,944.85 (-6.59%) | ₹2,882.3 – ₹3150 |
| Aegis Logistics | ₹834.84 (-5.67%) | ₹827 – ₹871.09 |
| Fine Organics | ₹5551 (-5.48%) | ₹5505 – ₹5,764.14 |
| Poly Medicure | ₹1871 (-4.82%) | ₹1,862.05 – ₹1,957.44 |
| Birlasoft | ₹675.5 (-4.8%) | ₹673.75 – ₹712.65 |
Nifty 51 to 500 Stocks To Watch for Tomorrow
Eris Lifesciences: A Bullish Trend to Watch
- Performance Overview: Eris Lifesciences has shown strong momentum in recent trading. Over the past 26 sessions, it closed higher 18 times and lower 8 times, highlighting a positive trend.
- Recent Trend: Eris Lifesciences has been on an impressive 8-day winning streak, closing higher each day since Friday, July 19, 2024.
- Returns: In the last 26 trading sessions, Eris Lifesciences delivered a solid 8.33% return. This means an initial investment of ₹10,000 would have grown to ₹10,833.
- Financial Insight: Eris Lifesciences has demonstrated strong financial performance over the past year. It generated revenue of ₹1,991.29 Crore and earned a profit of ₹391.98 Crore.
- As of Wednesday, July 31, 2024, Eris Lifesciences boasts a Market Capital of ₹14,607.65 Crore.
- Summary: Eris Lifesciences exhibits a robust bullish pattern, making it an interesting stock to watch. Investors may want to consider both short-term and long-term growth prospects. To explore potential price targets, check out Eris Lifesciences Target for Tomorrow and Eris Lifesciences Targets for 2024 & 2025.
Eris Lifesciences Financial Performance
| Metric | Value | Description |
|---|---|---|
| Market Capital | 14,607.65 Crore | Market valuation of Eris Lifesciences’s shares. |
| Revenue (TTM) | 1,991.29 Crore | Total revenue generated by Eris Lifesciences over the past twelve months. |
| Net Income (TTM) | +391.98 Crore | Net Profit or Loss after all the expenses over the past twelve months. |
| Operating Margin | 17.27% | Income from operations as a percentage of revenue, before taxes and interest. |
| Profit Margin | 19.68% | Net income as a percentage of revenue, after all expenses. |
| Revenue Growth (Quarterly) | +38% | Change in revenue compared to the previous quarter. |
| Earnings Growth (YOY Quarterly) | +8.5% | Change in earnings compared to the same quarter last year. |
| Debt-to-Equity (D/E) Ratio | 86.32 | Company’s total debt divided by total shareholder equity. |
| Total Debt | 2,781.26 Crore | Sum of Eris Lifesciences’s current & long-term financial obligations. |
| Total Cash | 1,400.63 Crore | Total amount of liquid funds available to Eris Lifesciences. |
| Beta | 0.36 | Beta is less than 1 indicating that the Eris Lifesciences’s price is less volatile than the market. |
➲ Poly Medicure (Bearish Pattern)
- Performance Overview: Over the last 26 trading days, Poly Medicure has had a bit of a rollercoaster ride, closing lower on 17 days and higher on 9.
- Recent Trend: Things haven’t been looking great for Poly Medicure lately. It’s been on a 10-day losing streak, with no green days since Tuesday, July 16, 2024.
- Returns: In those 26 trading days, Poly Medicure’s returns have been down 8.53%. This means an investment of ₹10,000 would have become ₹9,147.
- Financial Insight: Over the past year, Eris Lifesciences brought in a revenue of ₹1,375.79 Crore and made a profit of ₹258.25 Crore.
- As of Wednesday, July 31, 2024, Eris Lifesciences has a Market Capital of ₹17,404.89 Crore.
- Summary: Poly Medicure is currently facing a bearish period. Keep a close eye on its performance. You can find more details about Poly Medicure’s potential target for tomorrow and its potential targets for 2024 and 2025.
Poly Medicure Financial Performance
| Metric | Value | Description |
|---|---|---|
| Market Capital | 17,404.89 Crore | Market valuation of Poly Medicure’s shares. |
| Revenue (TTM) | 1,375.79 Crore | Total revenue generated by Poly Medicure over the past twelve months. |
| Net Income (TTM) | +258.25 Crore | Net Profit or Loss after all the expenses over the past twelve months. |
| Operating Margin | 21.26% | Income from operations as a percentage of revenue, before taxes and interest. |
| Profit Margin | 18.77% | Net income as a percentage of revenue, after all expenses. |
| Revenue Growth (Quarterly) | +23.2% | Change in revenue compared to the previous quarter. |
| Earnings Growth (YOY Quarterly) | +16.2% | Change in earnings compared to the same quarter last year. |
| Debt-to-Equity (D/E) Ratio | 11.84 | Company’s total debt divided by total shareholder equity. |
| Total Debt | 174.15 Crore | Sum of Poly Medicure’s current & long-term financial obligations. |
| Total Cash | 286.39 Crore | Total amount of liquid funds available to Poly Medicure. |
| Beta | 0.34 | Beta is less than 1 indicating that the Poly Medicure’s price is less volatile than the market. |
Top Stocks That Created a New All Time High Today
Top Large Cap Stocks That Created a New All Time High Today
Companies with Market Capital more than 20,000 Crores| Stock | Close | New All-Time High (ATH) | Previous ATH | Previous ATH Date |
|---|---|---|---|---|
| Apar Industries | 9229.40 (+2.8%) | 9656.90 (+23.01%) | 7850.00 | Wed 24 Apr 2024 |
| Ashok Leyland | 257.00 (+1.34%) | 258.98 (+%) | Thu 01 Jan 1970 | |
| Aurobindo Pharma | 1434.15 (+2.47%) | 1440.65 (+%) | Thu 01 Jan 1970 | |
| BASF | 6295.00 (+3.07%) | 6345.00 (+%) | Thu 01 Jan 1970 | |
| Bayer Cropscience | 6956.50 (+0.13%) | 7103.70 (+%) | Thu 01 Jan 1970 |
Top Mid Cap Stocks That Created a New All Time High Today
Companies with Market Capital between 5,000 Crores to 20,000 Crores| Stock | Close | New All-Time High (ATH) | Previous ATH | Previous ATH Date |
|---|---|---|---|---|
| Black Box | 512.40 (+4.77%) | 513.50 (+%) | Thu 01 Jan 1970 | |
| Blue Jet Healthcare | 466.54 (+2.45%) | 480.00 (+%) | Thu 01 Jan 1970 | |
| CAMS | 4500.50 (-3.14%) | 4908.45 (+%) | Thu 01 Jan 1970 | |
| ELANTAS Beck India | 12449.95 (-2.71%) | 12998.00 (+30.11%) | 9990.00 | Mon 01 Apr 2024 |
| Electrosteel Castings | 215.89 (-0.83%) | 224.33 (+8.89%) | 206.00 | Mon 22 Apr 2024 |
Top Small Cap Stocks That Created a New All Time High Today
Companies with Market Capital less than 5,000 Crores| Stock | Close | New All-Time High (ATH) | Previous ATH | Previous ATH Date |
|---|---|---|---|---|
| 21ST CENTURY MANAG | 82.96 (+1.99%) | 82.96 (+%) | Thu 01 Jan 1970 | |
| ACGL | 2800.05 (+17.44%) | 2861.00 (+%) | Thu 01 Jan 1970 | |
| BALUFORGE | 514.34 (+4.65%) | 533.29 (+%) | Thu 01 Jan 1970 | |
| BCC Fuba India | 100.99 (-5%) | 111.61 (+%) | Thu 01 Jan 1970 | |
| Bhilwara Spinners | 162.50 (+6.17%) | 169.00 (+%) | Thu 01 Jan 1970 |