Home / Fri 28 Jun 2024 Market Recap
28 Jun 2024: Nifty Closed at ₹24,009.8 (-0.15%), GRASIM Shows Bullish Signs, While Eicher Motors Dips. Reliance Industries Creates New All-Time Highs!
Show Table of Contents
Table of Contents
- 1: Top Indices Performance Overview
- 2: Nifty 50 Performance Overview
- 2.1: Nifty 50 Top Gainers
- 2.2: Nifty 50 Top Losers
- 2.3: Nifty 50 Stocks To Watch for Tomorrow
- 2.3.1: GRASIM (Bullish Pattern)
- 2.3.2: ➲ Eicher Motors (Showing Bearish Signs)
- 3: Nifty 500 Performance Overview
- 3.1: Nifty 500 Top Gainers
- 3.2: Nifty 500 Top Losers
- 3.3: Nifty 51 to 500 Stocks To Watch for Tomorrow
- 3.3.1: Indus Towers: A Bullish Outlook
- 3.3.2: ➲ Anupam Rasayan (Showing Bearish Trends)
- 4: Top Stocks That Created a New All Time High Today
- 4.1: Top Large Cap Stocks That Created a New All Time High Today
- 4.2: Top Mid Cap Stocks That Created a New All Time High Today
- 4.3: Top Small Cap Stocks That Created a New All Time High Today
Top Indices Performance Overview
| Stock | Close | Range |
|---|---|---|
| NIFTY 50 | ₹24,009.8 (-0.15%) | ₹23,985.8 – ₹24174 |
| NIFTY BANK | ₹52,342.25 (-0.89%) | ₹52,242.3 – ₹53,030.3 |
| NIFTY FIN SERVICE | ₹23,417.94 (-0.88%) | ₹23380 – ₹23,711.05 |
| NIFTY IT | ₹36,157.5 (0.09%) | ₹36,041.19 – ₹36,334.64 |
| NIFTY AUTO | ₹25,197.3 (0.02%) | ₹25,121.19 – ₹25339 |
| NIFTY ENERGY | ₹41,808.8 (1.12%) | ₹41,446.19 – ₹42,028.39 |
Nifty 50 Performance Overview
The Nifty 50 opened the day at ₹24,085.84, setting the stage for a day of trading. Throughout the session, it went on a bit of a roller coaster ride, dipping to a low of ₹23,985.8 and climbing to a high of ₹24,174 before settling at a close of ₹24,009.8 (-0.15%).
Take a look at the top gainers and losers for today – these stocks were the movers and shakers that influenced the Nifty 50’s performance.
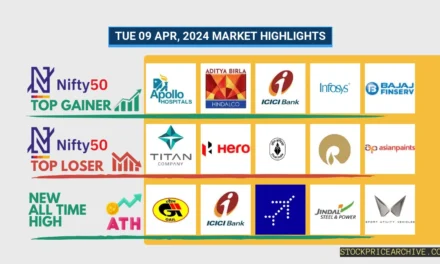
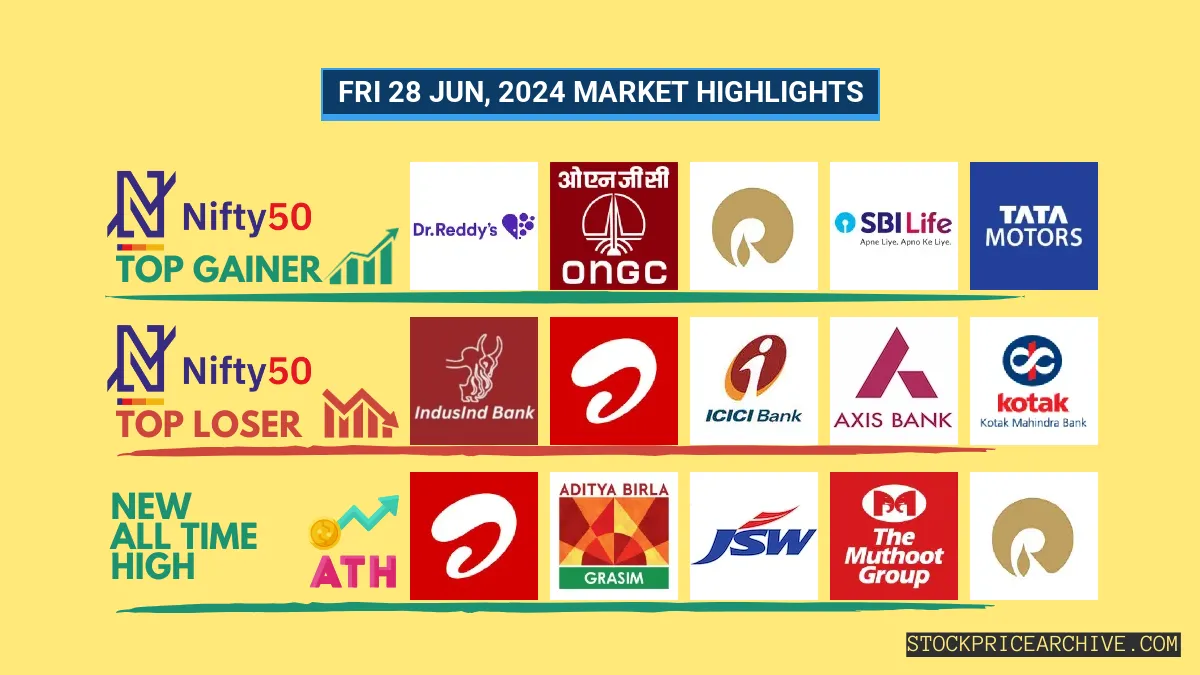
Nifty 50 Top Gainers
| Stock | Close | Range |
|---|---|---|
| Dr Reddy Lab | ₹6,402.35 (2.66%) | ₹6,251.04 – ₹6420 |
| ONGC | ₹274.45 (2.59%) | ₹268.35 – ₹275.45 |
| Reliance Industries | ₹3,128.25 (2.19%) | ₹3,062.05 – ₹3162 |
| SBI Life Insurance | ₹1,491.94 (1.94%) | ₹1450 – ₹1,498.8 |
| Tata Motors | ₹989.45 (1.78%) | ₹972.54 – ₹998.5 |
Nifty 50 Top Losers
| Stock | Close | Range |
|---|---|---|
| IndusInd Bank | ₹1,464.19 (-2.57%) | ₹1,460.5 – ₹1491 |
| Bharti Airtel | ₹1,444.05 (-2.16%) | ₹1,436.65 – ₹1,536.25 |
| ICICI BANK | ₹1,197.25 (-1.86%) | ₹1,196.33 – ₹1227 |
| Axis Bank | ₹1,265.25 (-1.84%) | ₹1,261.58 – ₹1,289.9 |
| Kotak Mahindra Bank | ₹1,803.09 (-1.51%) | ₹1,798.9 – ₹1,847.94 |
Nifty 50 Stocks To Watch for Tomorrow
GRASIM (Bullish Pattern)
- Performance Overview: Over the past 26 trading days, GRASIM has closed higher 16 times and lower 10 times.
- Recent Trend: GRASIM has been on a strong run, closing higher for the past five trading days, since Friday, June 21, 2024.
- Returns: In the last 26 trading sessions, GRASIM has delivered a solid 9.35% return. This means an investment of ₹10,000 would have grown to ₹10,935.
- Financial Insight: In the last 12 months, GRASIM has generated impressive revenue of ₹1,30,978.48 Crore and recorded a profit of ₹5,624.48 Crore.
- As of Friday, June 28, 2024, GRASIM has a Market Capital of ₹1,67,310.76 Crore.
- Summary: GRASIM is showing a strong bullish pattern. It’s worth keeping an eye on its price movements to see if it continues its upward trajectory. Investors may want to consider its short-term and long-term growth potential. Checkout GRASIM Target for Tomorrow and GRASIM Targets for 2024 & 2025.
GRASIM Financial Performance
| Metric | Value | Description |
|---|---|---|
| Market Capital | 1,67,310.76 Crore | Market valuation of GRASIM’s shares. |
| Revenue (TTM) | 1,30,978.48 Crore | Total revenue generated by GRASIM over the past twelve months. |
| Net Income (TTM) | +5,624.48 Crore | Net Profit or Loss after all the expenses over the past twelve months. |
| Operating Margin | 17.39% | Income from operations as a percentage of revenue, before taxes and interest. |
| Profit Margin | 4.29% | Net income as a percentage of revenue, after all expenses. |
| Revenue Growth (Quarterly) | +12.7% | Change in revenue compared to the previous quarter. |
| Earnings Growth (YOY Quarterly) | +0.1% | Change in earnings compared to the same quarter last year. |
| Debt-to-Equity (D/E) Ratio | 98.71 | Company’s total debt divided by total shareholder equity. |
| Total Debt | 1,37,155.05 Crore | Sum of GRASIM’s current & long-term financial obligations. |
| Total Cash | 22,925.35 Crore | Total amount of liquid funds available to GRASIM. |
| Beta | 0.54 | Beta is less than 1 indicating that the GRASIM’s price is less volatile than the market. |
➲ Eicher Motors (Showing Bearish Signs)
- Performance Overview: Over the past 26 trading days, Eicher Motors has closed lower 16 times and higher 10 times.
- Recent Trend: Eicher Motors has been on a downward trend for the past four days, with no gains since Monday, June 24, 2024.
- Returns: In the last 26 trading sessions, Eicher Motors has delivered a -0.51% return, meaning a ₹10,000 investment would be worth ₹9,949 today.
- Financial Insight: Over the past 12 months, GRASIM has generated a revenue of ₹16,535.77 Crore and earned a profit of ₹4,001.01 Crore.
- As of Friday, June 28, 2024, GRASIM has a Market Capital of ₹1,33,632.09 Crore.
- Summary: Eicher Motors is currently experiencing a downward trend. It’s a good idea for investors to keep a close eye on its performance, especially its potential movement in the coming days and its projected targets for 2024 and 2025.
Eicher Motors Financial Performance
| Metric | Value | Description |
|---|---|---|
| Market Capital | 1,33,632.09 Crore | Market valuation of Eicher Motors’s shares. |
| Revenue (TTM) | 16,535.77 Crore | Total revenue generated by Eicher Motors over the past twelve months. |
| Net Income (TTM) | +4,001.01 Crore | Net Profit or Loss after all the expenses over the past twelve months. |
| Operating Margin | 22.63% | Income from operations as a percentage of revenue, before taxes and interest. |
| Profit Margin | 24.19% | Net income as a percentage of revenue, after all expenses. |
| Revenue Growth (Quarterly) | +15.4% | Change in revenue compared to the previous quarter. |
| Earnings Growth (YOY Quarterly) | +18.2% | Change in earnings compared to the same quarter last year. |
| Debt-to-Equity (D/E) Ratio | 2.32 | Company’s total debt divided by total shareholder equity. |
| Total Debt | 419.44 Crore | Sum of Eicher Motors’s current & long-term financial obligations. |
| Total Cash | 327.23 Crore | Total amount of liquid funds available to Eicher Motors. |
| Beta | 0.59 | Beta is less than 1 indicating that the Eicher Motors’s price is less volatile than the market. |
Nifty 500 Performance Overview
The Nifty 500 kicked off the day at ₹22,592.25, showing some energy early on. It danced around a bit, reaching a peak of ₹22,673.65 before dipping to a low of ₹22,537.69. By the closing bell, it settled at ₹22,559.69, up a modest 0.09%.
Nifty 500 Top Gainers
| Stock | Close | Range |
|---|---|---|
| CDSL | ₹2,387.25 (18.99%) | ₹2,120.1 – ₹2,407.39 |
| Cholamandalam Financial | ₹1,453.5 (13%) | ₹1,289.08 – ₹1530 |
| Ceat | ₹2,821.85 (8.57%) | ₹2,591.85 – ₹2920 |
| IIFL Finance | ₹516.5 (7.63%) | ₹481.95 – ₹521.4 |
| Praj Industries | ₹730.45 (7.61%) | ₹678.75 – ₹742 |
Nifty 500 Top Losers
| Stock | Close | Range |
|---|---|---|
| Godfrey Phillips | ₹4125 (-4.1%) | ₹4114 – ₹4277 |
| Samvardhana Motherson | ₹191.1 (-3.76%) | ₹189.99 – ₹198.37 |
| Avenue Supermarts Dmart | ₹4,716.75 (-3.75%) | ₹4680 – ₹4,921.95 |
| Polycab India | ₹6735 (-3.64%) | ₹6616 – ₹6,823.29 |
| Route Mobile | ₹1,813.94 (-3.5%) | ₹1,805.05 – ₹1877 |
Nifty 51 to 500 Stocks To Watch for Tomorrow
Indus Towers: A Bullish Outlook
- Recent Performance: Indus Towers has been on a roll lately! In the last 26 trading sessions (from June 3rd to June 28th, 2024), the stock closed higher than the previous day 18 times. This indicates a strong upward trend.
- Hot Streak: Indus Towers has been on a 7-day winning streak, closing higher each day since Wednesday, June 19th, 2024. This consistent positive performance is catching the eye of investors.
- Strong Returns: Over the past 26 trading days, Indus Towers has delivered a solid 9.99% return. This means if you had invested ₹10,000 in Indus Towers on June 3rd, 2024, your investment would be worth ₹10,999 today.
- Financial Strength: Indus Towers has been performing well financially. In the past year (ending June 28th, 2024), the company generated ₹28,600.59 Crore in revenue and recorded a profit of ₹6,036.19 Crore. This strong financial performance suggests a healthy business model.
- Market Capital: As of Friday, June 28th, 2024, Indus Towers has a market capitalization of ₹90,638.62 Crore. This indicates a large and established company.
- Looking Ahead: The bullish pattern for Indus Towers suggests that the stock could continue to rise. While past performance isn’t a guarantee of future results, investors may want to keep an eye on its price movements and consider both short-term and long-term growth prospects. To help with your investment decisions, you can check out these resources: Indus Towers Target for Tomorrow and Indus Towers Targets for 2024 & 2025.
Indus Towers Financial Performance
| Metric | Value | Description |
|---|---|---|
| Market Capital | 90,638.62 Crore | Market valuation of Indus Towers’s shares. |
| Revenue (TTM) | 28,600.59 Crore | Total revenue generated by Indus Towers over the past twelve months. |
| Net Income (TTM) | +6,036.19 Crore | Net Profit or Loss after all the expenses over the past twelve months. |
| Operating Margin | 35.28% | Income from operations as a percentage of revenue, before taxes and interest. |
| Profit Margin | 21.1% | Net income as a percentage of revenue, after all expenses. |
| Revenue Growth (Quarterly) | +6.5% | Change in revenue compared to the previous quarter. |
| Earnings Growth (YOY Quarterly) | +32.4% | Change in earnings compared to the same quarter last year. |
| Debt-to-Equity (D/E) Ratio | 75.93 | Company’s total debt divided by total shareholder equity. |
| Total Debt | 20,531 Crore | Sum of Indus Towers’s current & long-term financial obligations. |
| Total Cash | 63.1 Crore | Total amount of liquid funds available to Indus Towers. |
| Beta | 0.23 | Beta is less than 1 indicating that the Indus Towers’s price is less volatile than the market. |
➲ Anupam Rasayan (Showing Bearish Trends)
- Performance Snapshot: Over the past 26 trading sessions, Anupam Rasayan’s stock has closed lower 16 times and higher 9 times.
- Recent Trend: The stock has been on a downward slide for the past 8 days, with no closing gains since Tuesday, June 18th, 2024.
- Returns: Anupam Rasayan has delivered a -2.2% return over the last 26 trading days. This means an investment of ₹10,000 would have dropped to ₹9,780 during this period.
- Financial Snapshot: Looking back over the past 12 months, Anupam Rasayan generated revenue of ₹1,475.06 Crore and achieved a profit of ₹128.6 Crore.
- As of Friday, June 28th, 2024, Anupam Rasayan boasts a Market Capital of ₹8,555.03 Crore.
- In a Nutshell: Anupam Rasayan is currently facing some headwinds. We encourage investors to pay close attention to its potential performance, especially when considering Anupam Rasayan’s Target for Tomorrow and Anupam Rasayan’s Targets for 2024 & 2025.
Anupam Rasayan Financial Performance
| Metric | Value | Description |
|---|---|---|
| Market Capital | 8,555.03 Crore | Market valuation of Anupam Rasayan’s shares. |
| Revenue (TTM) | 1,475.06 Crore | Total revenue generated by Anupam Rasayan over the past twelve months. |
| Net Income (TTM) | +128.6 Crore | Net Profit or Loss after all the expenses over the past twelve months. |
| Operating Margin | 17.94% | Income from operations as a percentage of revenue, before taxes and interest. |
| Profit Margin | 8.71% | Net income as a percentage of revenue, after all expenses. |
| Revenue Growth (Quarterly) | -18% | Change in revenue compared to the previous quarter. |
| Earnings Growth (YOY Quarterly) | -45.5% | Change in earnings compared to the same quarter last year. |
| Debt-to-Equity (D/E) Ratio | 36.51 | Company’s total debt divided by total shareholder equity. |
| Total Debt | 1,070.01 Crore | Sum of Anupam Rasayan’s current & long-term financial obligations. |
| Total Cash | 354.43 Crore | Total amount of liquid funds available to Anupam Rasayan. |
| Beta | 0.28 | Beta is less than 1 indicating that the Anupam Rasayan’s price is less volatile than the market. |
Top Stocks That Created a New All Time High Today
Top Large Cap Stocks That Created a New All Time High Today
Companies with Market Capital more than 20,000 Crores| Stock | Close | New All-Time High (ATH) | Previous ATH | Previous ATH Date |
|---|---|---|---|---|
| Aegis Logistics | 870.50 (+1.92%) | 914.00 (+64.99%) | 553.95 | Thu 18 Apr 2024 |
| Bharti Airtel | 1444.05 (-2.16%) | 1536.25 (+13.71%) | 1351.00 | Tue 23 Apr 2024 |
| CDSL | 2387.25 (+18.99%) | 2407.39 (+13.63%) | 2118.60 | Tue 23 Apr 2024 |
| Cholamandalam Financial | 1453.50 (+13%) | 1530.00 (+%) | Thu 01 Jan 1970 | |
| CIE Automotive India | 572.29 (-1.81%) | 594.65 (+%) | Thu 01 Jan 1970 |
Top Mid Cap Stocks That Created a New All Time High Today
Companies with Market Capital between 5,000 Crores to 20,000 Crores| Stock | Close | New All-Time High (ATH) | Previous ATH | Previous ATH Date |
|---|---|---|---|---|
| Bombay Burmah Trading Corp | 2025.50 (+7.4%) | 2167.69 (+%) | Thu 01 Jan 1970 | |
| Can Fin Homes | 915.20 (+0.47%) | 927.45 (+%) | Thu 01 Jan 1970 | |
| Great Eastern Shipping | 1225.00 (+2.85%) | 1255.00 (+14.4%) | 1097.00 | Wed 24 Apr 2024 |
| Granules India | 493.50 (-1.04%) | 507.35 (+%) | Thu 01 Jan 1970 | |
| Maharashtra Scooters | 8964.25 (+2.18%) | 9245.00 (+%) | Thu 01 Jan 1970 |
Top Small Cap Stocks That Created a New All Time High Today
Companies with Market Capital less than 5,000 Crores| Stock | Close | New All-Time High (ATH) | Previous ATH | Previous ATH Date |
|---|---|---|---|---|
| 21ST CENTURY MANAG | 66.58 (+1.99%) | 66.58 (+%) | Thu 01 Jan 1970 | |
| 3P LAND HOLDINGS L | 38.39 (+0.86%) | 41.52 (+%) | Thu 01 Jan 1970 | |
| Ahmedabad Steelcraft | 103.24 (+1.99%) | 103.24 (+%) | Thu 01 Jan 1970 | |
| A.K. Spintex | 216.20 (+19.97%) | 216.20 (+%) | Thu 01 Jan 1970 | |
| AMBO AGRITEC LIMITED | 92.00 (+4.54%) | 92.00 (+%) | Thu 01 Jan 1970 |