Home / Thu 27 Jun 2024 Market Recap
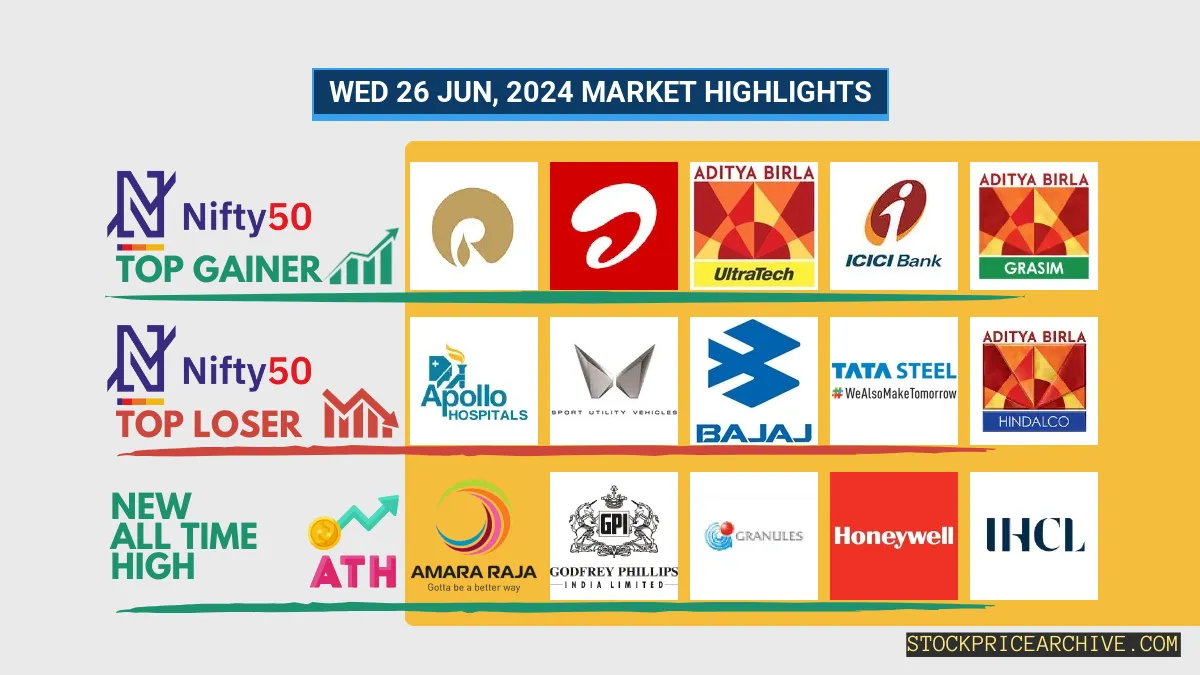
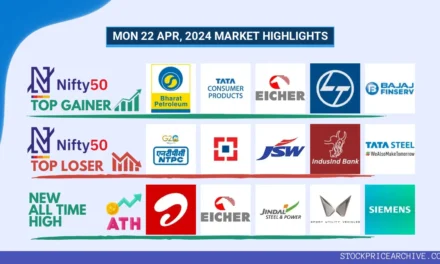
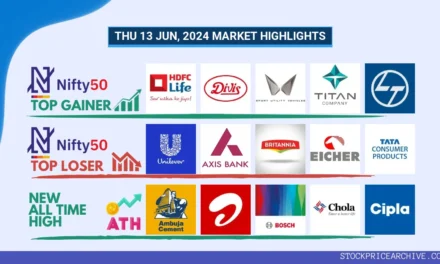
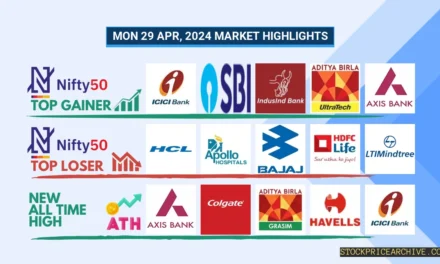
27 Jun 2024: Nifty closed at ₹24,044.5 (+0.73%), with UltraTech Cement & LTIMindtree leading the charge. ICICI Bank continues 8-day bullish streak!

Show Table of Contents
Table of Contents
- 1: Top Indices Performance Overview
- 2: Nifty 50 Performance Overview
- 2.1: Nifty 50 Top Gainers
- 2.2: Nifty 50 Top Losers
- 2.3: Nifty 50 Stocks To Watch for Tomorrow
- 2.3.1: ➲ ICICI BANK (Looking Strong)
- 2.3.2: ➲ Coal India (Bearish Pattern)
- 3: Nifty 500 Performance Overview
- 3.1: Nifty 500 Top Gainers
- 3.2: Nifty 500 Top Losers
- 3.3: Nifty 51 to 500 Stocks To Watch for Tomorrow
- 3.3.1: Samvardhana Motherson (Bullish Trend)
- 3.3.2: ➲ LIC (Bearish Pattern)
- 4: Top Stocks That Created a New All Time High Today
- 4.1: Top Large Cap Stocks That Created a New All Time High Today
- 4.2: Top Mid Cap Stocks That Created a New All Time High Today
- 4.3: Top Small Cap Stocks That Created a New All Time High Today
Top Indices Performance Overview
| Stock | Close | Range |
|---|---|---|
| NIFTY 50 | ₹24,044.5 (0.73%) | ₹23,805.4 – ₹24,087.44 |
| NIFTY BANK | ₹52,759.8 (-0.21%) | ₹52639 – ₹53,180.75 |
| NIFTY FIN SERVICE | ₹23,605.84 (0.05%) | ₹23,505.9 – ₹23,762.65 |
| NIFTY IT | ₹36,073.19 (1.88%) | ₹35,105.69 – ₹36,191.05 |
| NIFTY AUTO | ₹25,213.75 (0.77%) | ₹24,843.15 – ₹25,244.3 |
| NIFTY ENERGY | ₹41,360.85 (1.31%) | ₹40,735.89 – ₹41,478.89 |
Nifty 50 Performance Overview
The Nifty 50 started the day at ₹23,881.55, showing some volatility throughout the session. It dipped to a low of ₹23,805.4 before rallying to a high of ₹24,087.44. Ultimately, the index closed at ₹24,044.5, a gain of +0.73% for the day.
The gains and losses of specific stocks played a role in shaping the Nifty 50’s movement. You can find a table with the top gainers and losers below.
Nifty 50 Top Gainers
| Stock | Close | Range |
|---|---|---|
| UltraTech Cement | ₹11,716.7 (5.14%) | ₹11269 – ₹11,874.95 |
| LTIMindtree | ₹5,363.1 (3.58%) | ₹5125 – ₹5,389.95 |
| GRASIM | ₹2,637.6 (3.34%) | ₹2,552.25 – ₹2,654.64 |
| NTPC | ₹377.14 (3.31%) | ₹364.1 – ₹381.1 |
| WIPRO | ₹510.79 (3.14%) | ₹489.2 – ₹511.95 |
Nifty 50 Top Losers
| Stock | Close | Range |
|---|---|---|
| Larsen Toubro | ₹3565 (-1.06%) | ₹3550 – ₹3,601.3 |
| Eicher Motors | ₹4,713.79 (-0.55%) | ₹4,682.04 – ₹4,766.45 |
| Divis Lab | ₹4,522.35 (-0.51%) | ₹4507 – ₹4,556.04 |
| UPL | ₹568 (-0.42%) | ₹559.25 – ₹574.59 |
| Bajaj Auto | ₹9,441.84 (-0.35%) | ₹9,365.9 – ₹9,559.9 |
Nifty 50 Stocks To Watch for Tomorrow
➲ ICICI BANK (Looking Strong)
- Performance Overview: In the last 26 trading days, ICICI BANK closed higher than the previous day 17 times and lower 9 times.
- Recent Trend: ICICI BANK has been on an impressive 8-day winning streak, closing higher every day since Friday, June 14, 2024.
- Returns: ICICI BANK delivered an 8.43% return over the past 26 trading days. That means if you invested ₹10,000, you’d be sitting on ₹10,843 today!
- Financial Insight: Over the past year, ICICI BANK has generated a revenue of ₹1,58,217.15 Crore and earned a profit of ₹44,256.36 Crore. That’s a pretty strong showing!
- As of Thursday, June 27, 2024, ICICI BANK has a Market Capital of ₹8,15,153.17 Crore.
- Summary: ICICI BANK is showing a positive trend. If you’re interested in this stock, you might want to keep an eye on its price movements for both short-term and long-term opportunities. You can check out these resources to get a better sense of where ICICI BANK might be headed: Checkout ICICI BANK Target for Tomorrow and ICICI BANK Targets for 2024 & 2025.
ICICI BANK Financial Performance
| Metric | Value | Description |
|---|---|---|
| Market Capital | 8,15,153.17 Crore | Market valuation of ICICI BANK’s shares. |
| Revenue (TTM) | 1,58,217.15 Crore | Total revenue generated by ICICI BANK over the past twelve months. |
| Net Income (TTM) | +44,256.36 Crore | Net Profit or Loss after all the expenses over the past twelve months. |
| Operating Margin | 35.07% | Income from operations as a percentage of revenue, before taxes and interest. |
| Profit Margin | 27.97% | Net income as a percentage of revenue, after all expenses. |
| Revenue Growth (Quarterly) | +77.6% | Change in revenue compared to the previous quarter. |
| Earnings Growth (YOY Quarterly) | +18.5% | Change in earnings compared to the same quarter last year. |
| Debt-to-Equity (D/E) Ratio | 0.82 | Company’s total debt divided by total shareholder equity. |
| Total Debt | 2,07,427.99 Crore | Sum of ICICI BANK’s current & long-term financial obligations. |
| Total Cash | 1,62,768.9 Crore | Total amount of liquid funds available to ICICI BANK. |
| Beta | 0.85 | Beta is less than 1 indicating that the ICICI BANK’s price is less volatile than the market. |
➲ Coal India (Bearish Pattern)
- Performance Overview: In the last 26 trading sessions, Coal India has closed lower 16 times and higher 10 times.
- Recent Trend: Coal India has been on a 5-day losing streak, without a single day closing higher since Thursday, June 20, 2024.
- Returns: Coal India has experienced a -5.25% return over the last 26 trading sessions. This means an investment of ₹10,000 would be worth ₹9,475 today.
- Financial Insight: Over the past 12 months, Coal India has generated a revenue of ₹1,30,325.64 Crore and a profit of ₹37,402.28 Crore.
- As of Thursday, June 27, 2024, Coal India has a Market Capital of ₹2,97,752.33 Crore.
- Summary: Coal India is currently facing a bearish trend. We recommend investors stay informed and pay close attention to the short-term target for Coal India and long-term targets for 2024 & 2025.
Coal India Financial Performance
| Metric | Value | Description |
|---|---|---|
| Market Capital | 2,97,752.33 Crore | Market valuation of Coal India’s shares. |
| Revenue (TTM) | 1,30,325.64 Crore | Total revenue generated by Coal India over the past twelve months. |
| Net Income (TTM) | +37,402.28 Crore | Net Profit or Loss after all the expenses over the past twelve months. |
| Operating Margin | 27.27% | Income from operations as a percentage of revenue, before taxes and interest. |
| Profit Margin | 28.69% | Net income as a percentage of revenue, after all expenses. |
| Revenue Growth (Quarterly) | -25.2% | Change in revenue compared to the previous quarter. |
| Earnings Growth (YOY Quarterly) | +56.89% | Change in earnings compared to the same quarter last year. |
| Debt-to-Equity (D/E) Ratio | 7.8 | Company’s total debt divided by total shareholder equity. |
| Total Debt | 6,523.02 Crore | Sum of Coal India’s current & long-term financial obligations. |
| Total Cash | 33,486.27 Crore | Total amount of liquid funds available to Coal India. |
| Beta | 0.3 | Beta is less than 1 indicating that the Coal India’s price is less volatile than the market. |
Nifty 500 Performance Overview
The Nifty 500 kicked off the day at ₹22,460.05, showing some energy early on. It danced around a bit, reaching a high of ₹22,571.4 before dipping to a low of ₹22,396.5. At the closing bell, it ended the day strong, settling at ₹22,541.84 (+0.46%).
Nifty 500 Top Gainers
| Stock | Close | Range |
|---|---|---|
| Route Mobile | ₹1,856.8 (12.87%) | ₹1,620.25 – ₹1930 |
| India Cements | ₹292.04 (11.2%) | ₹275.1 – ₹298.79 |
| Whirlpool | ₹2,002.9 (9.02%) | ₹1,952.55 – ₹2199 |
| Macrotech Developers | ₹1550 (8.02%) | ₹1,438.55 – ₹1550 |
| Suven Pharmaceuticals | ₹787.34 (7.96%) | ₹729.29 – ₹807.4 |
Nifty 500 Top Losers
| Stock | Close | Range |
|---|---|---|
| Deepak Fertilisers | ₹660 (-5.89%) | ₹648.09 – ₹696.95 |
| Equitas Small Finance Bank | ₹98.28 (-4.9%) | ₹97.95 – ₹103.39 |
| G R Infra | ₹1,749.75 (-4.89%) | ₹1735 – ₹1,826.8 |
| Archean Chemical | ₹658.5 (-4.8%) | ₹654.29 – ₹672.79 |
| Chambal Fertilizers | ₹497.5 (-4.43%) | ₹494.35 – ₹516.95 |
Nifty 51 to 500 Stocks To Watch for Tomorrow
Samvardhana Motherson (Bullish Trend)
- Performance Overview: Over the last 26 trading days, Samvardhana Motherson has closed higher than the previous day 21 times and lower 5 times. This suggests a strong upward trend.
- Recent Trend: Samvardhana Motherson has been on an impressive 11-day winning streak, closing higher every day since Tuesday, June 11, 2024.
- Returns: In these 26 trading sessions, Samvardhana Motherson delivered a remarkable 49.21% return. This means an investment of ₹10,000 would have grown to ₹14,921.
- Financial Insight: In the past 12 months, Samvardhana Motherson generated a significant revenue of ₹97,779.41 Crore and achieved a profit of ₹2,716.19 Crore.
- As of Thursday, June 27, 2024, Samvardhana Motherson boasts a Market Capital of ₹1,28,432.2 Crore.
- Summary: Samvardhana Motherson is currently displaying a strong bullish pattern. Investors might want to keep a close eye on its price movements and consider its potential for both short-term and long-term growth. For more detailed insights, check out Samvardhana Motherson Target for Tomorrow and Samvardhana Motherson Targets for 2024 & 2025.
Samvardhana Motherson Financial Performance
| Metric | Value | Description |
|---|---|---|
| Market Capital | 1,28,432.2 Crore | Market valuation of Samvardhana Motherson’s shares. |
| Revenue (TTM) | 97,779.41 Crore | Total revenue generated by Samvardhana Motherson over the past twelve months. |
| Net Income (TTM) | +2,716.19 Crore | Net Profit or Loss after all the expenses over the past twelve months. |
| Operating Margin | 6.9% | Income from operations as a percentage of revenue, before taxes and interest. |
| Profit Margin | 2.77% | Net income as a percentage of revenue, after all expenses. |
| Revenue Growth (Quarterly) | +21% | Change in revenue compared to the previous quarter. |
| Earnings Growth (YOY Quarterly) | +109.8% | Change in earnings compared to the same quarter last year. |
| Debt-to-Equity (D/E) Ratio | 70.6 | Company’s total debt divided by total shareholder equity. |
| Total Debt | 19,921.83 Crore | Sum of Samvardhana Motherson’s current & long-term financial obligations. |
| Total Cash | 7,084.38 Crore | Total amount of liquid funds available to Samvardhana Motherson. |
| Beta | 1.53 | Beta is greater than 1 indicating that the Samvardhana Motherson’s price is more volatile than the market. |
➲ LIC (Bearish Pattern)
- Performance Overview: Over the past 26 trading days, LIC has closed lower 15 times and higher 11 times.
- Recent Trend: LIC has been on a downward trend for the past 8 trading days, with no positive close since Friday, June 14th, 2024.
- Returns: LIC has generated a return of -3.69% over the last 26 trading days. This means that an investment of ₹10,000 would have become ₹9,631 during this period.
- Financial Insight: LIC has generated a revenue of ₹8,56,354.08 Crore and a profit of ₹42,329.76 Crore over the past 12 months.
- As of Thursday, June 27th, 2024, LIC has a Market Capital of ₹6,47,648.4 Crore.
- Summary: LIC is currently facing a bearish trend. We encourage investors to keep a close watch on the stock’s performance, particularly the projected target for tomorrow and the projected targets for 2024 and 2025.
LIC Financial Performance
| Metric | Value | Description |
|---|---|---|
| Market Capital | 6,47,648.4 Crore | Market valuation of LIC’s shares. |
| Revenue (TTM) | 8,56,354.08 Crore | Total revenue generated by LIC over the past twelve months. |
| Net Income (TTM) | +42,329.76 Crore | Net Profit or Loss after all the expenses over the past twelve months. |
| Operating Margin | 6.27% | Income from operations as a percentage of revenue, before taxes and interest. |
| Profit Margin | 4.94% | Net income as a percentage of revenue, after all expenses. |
| Revenue Growth (Quarterly) | +26.3% | Change in revenue compared to the previous quarter. |
| Earnings Growth (YOY Quarterly) | +72.09% | Change in earnings compared to the same quarter last year. |
| Total Cash | 41,824.46 Crore | Total amount of liquid funds available to LIC. |
| Beta | 0.6 | Beta is less than 1 indicating that the LIC’s price is less volatile than the market. |
Top Stocks That Created a New All Time High Today
Top Large Cap Stocks That Created a New All Time High Today
Companies with Market Capital more than 20,000 Crores| Stock | Close | New All-Time High (ATH) | Previous ATH | Previous ATH Date |
|---|---|---|---|---|
| Axis Bank | 1288.50 (+0.24%) | 1302.50 (+%) | Thu 01 Jan 1970 | |
| Bayer Cropscience | 6650.00 (+1.64%) | 6825.00 (+%) | Thu 01 Jan 1970 | |
| Bharti Airtel | 1480.00 (+1.4%) | 1488.84 (+10.2%) | 1351.00 | Tue 23 Apr 2024 |
| Bosch | 36102.94 (+5.72%) | 36102.94 (+15.9%) | 31150.00 | Wed 27 Mar 2024 |
| Dixon Technologies | 11670.00 (+2.38%) | 11947.00 (+49.65%) | 7983.00 | Fri 12 Apr 2024 |
Top Mid Cap Stocks That Created a New All Time High Today
Companies with Market Capital between 5,000 Crores to 20,000 Crores| Stock | Close | New All-Time High (ATH) | Previous ATH | Previous ATH Date |
|---|---|---|---|---|
| Aditya Vision | 4389.95 (-3.2%) | 4559.85 (+%) | Thu 01 Jan 1970 | |
| Can Fin Homes | 913.59 (+1.37%) | 922.00 (+%) | Thu 01 Jan 1970 | |
| ESAB India | 6164.39 (-0.25%) | 6650.00 (+%) | Thu 01 Jan 1970 | |
| Gabriel India | 479.85 (-1%) | 517.00 (+%) | Thu 01 Jan 1970 | |
| GRSE | 2118.00 (+1.46%) | 2174.69 (+113.51%) | 1018.50 | Wed 24 Apr 2024 |
Top Small Cap Stocks That Created a New All Time High Today
Companies with Market Capital less than 5,000 Crores| Stock | Close | New All-Time High (ATH) | Previous ATH | Previous ATH Date |
|---|---|---|---|---|
| 20 Microns | 223.14 (+0.35%) | 234.91 (+%) | Thu 01 Jan 1970 | |
| 21ST CENTURY MANAG | 65.28 (+2%) | 65.28 (+%) | Thu 01 Jan 1970 | |
| Ahmedabad Steelcraft | 101.22 (+1.99%) | 101.22 (+%) | Thu 01 Jan 1970 | |
| Amines & Plasticizers Ltd | 299.67 (+1.64%) | 346.00 (+%) | Thu 01 Jan 1970 | |
| Asahi Songwon Colors | 448.00 (+9.02%) | 463.00 (+%) | Thu 01 Jan 1970 |


