Home / Wed 24 Jul 2024 Market Recap
24 Jul 2024: Nifty 50 Closes at ₹24,434.19 (-0.19%) with Apollo Hospitals and Adani Enterprises Showing Contrasting Trends
Show Table of Contents
Table of Contents
- 1: Top Indices Performance Overview
- 2: Nifty 50 Performance Overview
- 2.1: Nifty 50 Top Gainers
- 2.2: Nifty 50 Top Losers
- 2.3: Nifty 50 Stocks To Watch for Tomorrow
- 2.3.1: Apollo Hospitals (Bullish Pattern)
- 2.3.2: ➲ Adani Enterprises (Bearish Pattern)
- 3: Nifty 500 Performance Overview
- 3.1: Nifty 500 Top Gainers
- 3.2: Nifty 500 Top Losers
- 3.3: Nifty 51 to 500 Stocks To Watch for Tomorrow
- 3.3.1: Ajanta Pharma: Looking Bullish (✉️)
- 3.3.2: ➲ Rainbow Childrens Medicare (Bearish Trend)
- 4: Top Stocks That Created a New All Time High Today
- 4.1: Top Large Cap Stocks That Created a New All Time High Today
- 4.2: Top Mid Cap Stocks That Created a New All Time High Today
- 4.3: Top Small Cap Stocks That Created a New All Time High Today
Top Indices Performance Overview
| Stock | Close | Range |
|---|---|---|
| NIFTY 50 | ₹24,434.19 (-0.19%) | ₹24,307.25 – ₹24,504.25 |
| NIFTY BANK | ₹51,429.75 (-0.68%) | ₹50,784.25 – ₹51,944.64 |
| NIFTY FIN SERVICE | ₹23,210.15 (-0.41%) | ₹22,970.8 – ₹23387 |
| NIFTY IT | ₹40,115.05 (0.17%) | ₹39,918.75 – ₹40,282.1 |
| NIFTY AUTO | ₹25,309.05 (-0.05%) | ₹25,193.05 – ₹25,370.09 |
| NIFTY ENERGY | ₹42,234.35 (1.23%) | ₹41,592.1 – ₹42,509.85 |
Nifty 50 Performance Overview
The Nifty 50 kicked off the day at ₹24,445.05. Throughout the trading session, it saw some ups and downs, dipping to a low of ₹24,307.25 and reaching a high of ₹24,504.25. By the closing bell, it settled at ₹24,434.19, representing a slight dip of -0.19% for the day.
The movement of the Nifty 50 today was influenced by top gainers and losers, which we’ll explore in more detail below.
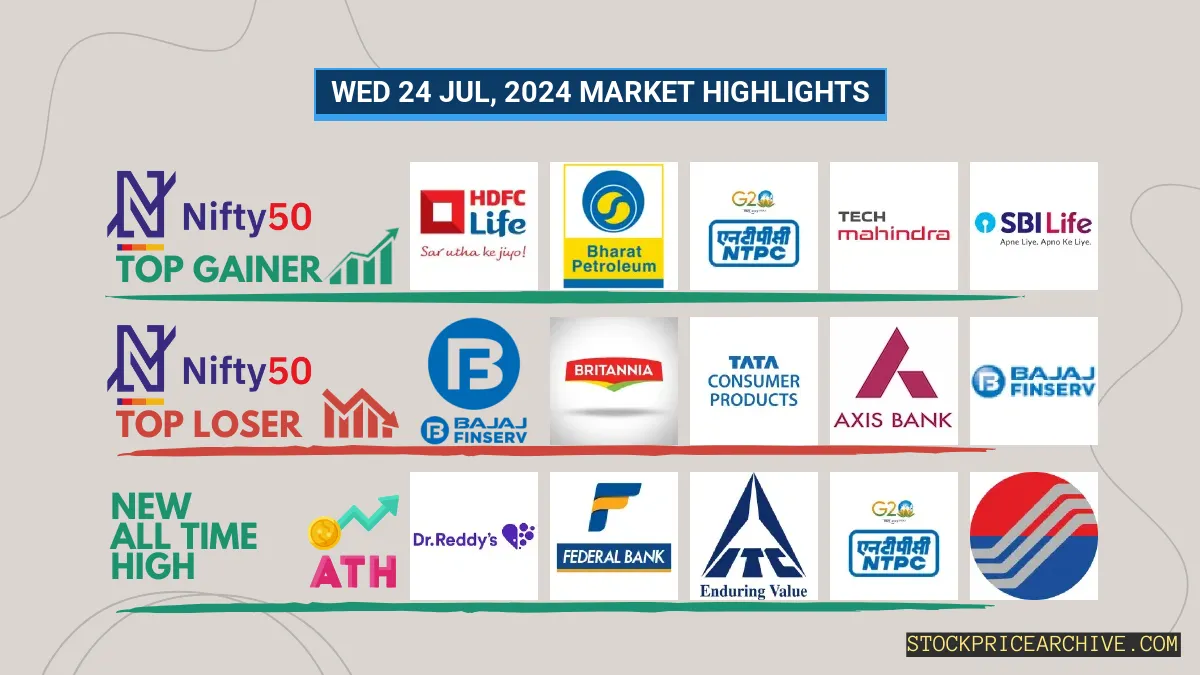
Nifty 50 Top Gainers
| Stock | Close | Range |
|---|---|---|
| HDFC Life | ₹671.4 (4.26%) | ₹639.29 – ₹675 |
| Bharat Petroleum | ₹314.54 (2.79%) | ₹304.85 – ₹315.85 |
| NTPC | ₹393 (2.75%) | ₹381.7 – ₹395 |
| Tech Mahindra | ₹1,533.3 (2.67%) | ₹1,473.4 – ₹1540 |
| SBI Life Insurance | ₹1636 (2.58%) | ₹1,579.65 – ₹1650 |
Nifty 50 Top Losers
| Stock | Close | Range |
|---|---|---|
| Bajaj Finserv | ₹1,579.25 (-2.45%) | ₹1562 – ₹1,611.9 |
| Britannia | ₹5,829.5 (-1.94%) | ₹5815 – ₹5,974.39 |
| Tata Consumer Products | ₹1233 (-1.91%) | ₹1,217.4 – ₹1,257.69 |
| Axis Bank | ₹1,239.25 (-1.9%) | ₹1,226.65 – ₹1,267.33 |
| Bajaj Finance | ₹6,607.14 (-1.79%) | ₹6,541.04 – ₹6,654.7 |
Nifty 50 Stocks To Watch for Tomorrow
Apollo Hospitals (Bullish Pattern)
- Performance Overview: In the last 26 trading sessions, Apollo Hospitals has closed higher than the previous day 17 times and lower 9 times.
- Recent Trend: Apollo Hospitals has been on a 3-day winning streak, without a single day closing lower since Fri 19 Jul 2024.
- Returns: Apollo Hospitals delivered a 3.17% return in the last 26 trading sessions, meaning an investment of ₹10,000 would have grown to ₹10,317.
- Financial Insight: Over the past 12 months, Apollo Hospitals has generated a revenue of ₹19,059.19 Crore and earned a profit of ₹898.6 Crore.
- As of Wed 24 Jul 2024, Apollo Hospitals has a Market Capital of ₹91,762.86 Crore.
- Summary: Apollo Hospitals is showing a strong bullish pattern. Keep an eye on its price movements as it holds potential for both short-term and long-term growth. Check out Apollo Hospitals Target for Tomorrow and Apollo Hospitals Targets for 2024 & 2025.
Apollo Hospitals Financial Performance
| Metric | Value | Description |
|---|---|---|
| Market Capital | 91,762.86 Crore | Market valuation of Apollo Hospitals’s shares. |
| Revenue (TTM) | 19,059.19 Crore | Total revenue generated by Apollo Hospitals over the past twelve months. |
| Net Income (TTM) | +898.6 Crore | Net Profit or Loss after all the expenses over the past twelve months. |
| Operating Margin | 9.11% | Income from operations as a percentage of revenue, before taxes and interest. |
| Profit Margin | 4.71% | Net income as a percentage of revenue, after all expenses. |
| Revenue Growth (Quarterly) | +14.89% | Change in revenue compared to the previous quarter. |
| Earnings Growth (YOY Quarterly) | +75.59% | Change in earnings compared to the same quarter last year. |
| Debt-to-Equity (D/E) Ratio | 72.84 | Company’s total debt divided by total shareholder equity. |
| Total Debt | 5,332.6 Crore | Sum of Apollo Hospitals’s current & long-term financial obligations. |
| Total Cash | 1,617.79 Crore | Total amount of liquid funds available to Apollo Hospitals. |
| Beta | 0.55 | Beta is less than 1 indicating that the Apollo Hospitals’s price is less volatile than the market. |
➲ Adani Enterprises (Bearish Pattern)
- Performance Overview: Over the past 26 trading days, Adani Enterprises has closed lower 17 times and higher 9 times. This suggests a bearish trend, with more red days than green.
- Recent Trend: Adani Enterprises is currently on a 5-day losing streak, not closing higher since Tuesday, July 16th, 2024.
- Returns: In the last 26 trading sessions, Adani Enterprises has experienced a -10.26% return. This means an investment of ₹10,000 would have decreased to ₹8,974.
- Financial Insight: Over the past 12 months, Apollo Hospitals has generated a revenue of ₹96,420.98 Crore and recorded a profit of ₹3,104.19 Crore.
- As of Wednesday, July 24th, 2024, Apollo Hospitals has a Market Capital of ₹3,42,649.78 Crore.
- Summary: Adani Enterprises is currently in a bearish phase. We recommend investors keep a close eye on the stock, particularly looking at the Adani Enterprises Target for Tomorrow and Adani Enterprises Targets for 2024 & 2025.
Adani Enterprises Financial Performance
| Metric | Value | Description |
|---|---|---|
| Market Capital | 3,42,649.78 Crore | Market valuation of Adani Enterprises’s shares. |
| Revenue (TTM) | 96,420.98 Crore | Total revenue generated by Adani Enterprises over the past twelve months. |
| Net Income (TTM) | +3,104.19 Crore | Net Profit or Loss after all the expenses over the past twelve months. |
| Operating Margin | 8.76% | Income from operations as a percentage of revenue, before taxes and interest. |
| Profit Margin | 3.36% | Net income as a percentage of revenue, after all expenses. |
| Revenue Growth (Quarterly) | -6.9% | Change in revenue compared to the previous quarter. |
| Earnings Growth (YOY Quarterly) | -37.6% | Change in earnings compared to the same quarter last year. |
| Debt-to-Equity (D/E) Ratio | 147.8 | Company’s total debt divided by total shareholder equity. |
| Total Debt | 65,310.14 Crore | Sum of Adani Enterprises’s current & long-term financial obligations. |
| Total Cash | 4,380.95 Crore | Total amount of liquid funds available to Adani Enterprises. |
| Beta | 0.93 | Beta is less than 1 indicating that the Adani Enterprises’s price is less volatile than the market. |
Nifty 500 Performance Overview
The Nifty 500 kicked off the day at ₹22,855.84. Throughout the trading session, it experienced some ups and downs, hitting a low of ₹22,820.3 and reaching a high of ₹22,964.94 before finally settling at a close of ₹22,941.05 (+0.33%).
The top gainers and losers played a role in shaping the Nifty 500’s movement today.
Nifty 500 Top Gainers
| Stock | Close | Range |
|---|---|---|
| MMTC | ₹102.6 (19.99%) | ₹84.96 – ₹102.6 |
| Avanti Feeds | ₹734.75 (13.85%) | ₹652.09 – ₹764.4 |
| IDBI Bank | ₹97.88 (13.26%) | ₹85.72 – ₹98.6 |
| Epigral | ₹1665 (13.13%) | ₹1,481.09 – ₹1724 |
| Castrol | ₹270.54 (9.7%) | ₹245.27 – ₹274.79 |
Nifty 500 Top Losers
| Stock | Close | Range |
|---|---|---|
| Phoenix Mills | ₹3562 (-5.81%) | ₹3549 – ₹3775 |
| Godrej Consumer | ₹1,459.05 (-3.81%) | ₹1454 – ₹1,519.84 |
| Bandhan Bank | ₹188.1 (-3.8%) | ₹186.53 – ₹198.39 |
| Sumitomo Chemical India | ₹501 (-3.23%) | ₹498.04 – ₹515.95 |
| Sundaram Finance | ₹4,510.85 (-2.93%) | ₹4480 – ₹4,633.7 |
Nifty 51 to 500 Stocks To Watch for Tomorrow
Ajanta Pharma: Looking Bullish (✉️)
- Performance Overview: Over the last 26 trading days (since July 1st), Ajanta Pharma has closed higher on 14 days and lower on 12 days.
- Recent Trend: Ajanta Pharma has been on a roll, closing higher for the past 5 trading days! The stock hasn’t dipped since July 16th.
- Returns: If you invested ₹10,000 in Ajanta Pharma on July 1st, it would have grown to ₹10,061 as of July 24th, representing a 0.61% return.
- Financial Insight: In the past 12 months, Ajanta Pharma generated impressive revenue of ₹4,208.71 Crore and a profit of ₹816.16 Crore.
- Market Size: As of July 24th, 2024, Ajanta Pharma has a market capitalization of ₹28,569.38 Crore.
- Summary: Ajanta Pharma is exhibiting a strong bullish pattern, making it an interesting stock to watch. Whether you’re looking for short-term gains or long-term growth, consider exploring the potential of Ajanta Pharma: Checkout Ajanta Pharma Target for Tomorrow and Ajanta Pharma Targets for 2024 & 2025.
Ajanta Pharma Financial Performance
| Metric | Value | Description |
|---|---|---|
| Market Capital | 28,569.38 Crore | Market valuation of Ajanta Pharma’s shares. |
| Revenue (TTM) | 4,208.71 Crore | Total revenue generated by Ajanta Pharma over the past twelve months. |
| Net Income (TTM) | +816.16 Crore | Net Profit or Loss after all the expenses over the past twelve months. |
| Operating Margin | 24.01% | Income from operations as a percentage of revenue, before taxes and interest. |
| Profit Margin | 19.39% | Net income as a percentage of revenue, after all expenses. |
| Revenue Growth (Quarterly) | +19.5% | Change in revenue compared to the previous quarter. |
| Earnings Growth (YOY Quarterly) | +65.8% | Change in earnings compared to the same quarter last year. |
| Debt-to-Equity (D/E) Ratio | 1.03 | Company’s total debt divided by total shareholder equity. |
| Total Debt | 36.84 Crore | Sum of Ajanta Pharma’s current & long-term financial obligations. |
| Total Cash | 459.54 Crore | Total amount of liquid funds available to Ajanta Pharma. |
| Beta | 0.04 | Beta is less than 1 indicating that the Ajanta Pharma’s price is less volatile than the market. |
➲ Rainbow Childrens Medicare (Bearish Trend)
- Performance Snapshot: Over the last 26 trading days, Rainbow Childrens Medicare has closed lower than the previous day 17 times, and higher 9 times.
- Recent Trend: Rainbow Childrens Medicare has been on a 9-day downward streak, with no gains since Wednesday, July 10, 2024.
- Returns: Rainbow Childrens Medicare has experienced a -17.02% return over the past 26 trading days. This means that a ₹10,000 investment in the stock would have shrunk to ₹8,298.
- Financial Snapshot: Looking back at the past 12 months, Rainbow Childrens Medicare generated a revenue of ₹1,272.76 Crore and a profit of ₹219.62 Crore.
- As of Wednesday, July 24, 2024, Rainbow Childrens Medicare has a Market Capitalization of ₹12,637.5 Crore.
- Summary: Rainbow Childrens Medicare is currently experiencing a bearish period. We suggest keeping a close watch on the stock’s performance, especially Rainbow Childrens Medicare Target for Tomorrow and Rainbow Childrens Medicare Targets for 2024 & 2025.
Rainbow Childrens Medicare Financial Performance
| Metric | Value | Description |
|---|---|---|
| Market Capital | 12,637.5 Crore | Market valuation of Rainbow Childrens Medicare’s shares. |
| Revenue (TTM) | 1,272.76 Crore | Total revenue generated by Rainbow Childrens Medicare over the past twelve months. |
| Net Income (TTM) | +219.62 Crore | Net Profit or Loss after all the expenses over the past twelve months. |
| Operating Margin | 26.91% | Income from operations as a percentage of revenue, before taxes and interest. |
| Profit Margin | 17.25% | Net income as a percentage of revenue, after all expenses. |
| Revenue Growth (Quarterly) | +9.6% | Change in revenue compared to the previous quarter. |
| Earnings Growth (YOY Quarterly) | +7.3% | Change in earnings compared to the same quarter last year. |
| Debt-to-Equity (D/E) Ratio | 55.14 | Company’s total debt divided by total shareholder equity. |
| Total Debt | 631.29 Crore | Sum of Rainbow Childrens Medicare’s current & long-term financial obligations. |
| Total Cash | 464.61 Crore | Total amount of liquid funds available to Rainbow Childrens Medicare. |
| Beta | 0.34 | Beta is less than 1 indicating that the Rainbow Childrens Medicare’s price is less volatile than the market. |
Top Stocks That Created a New All Time High Today
Top Large Cap Stocks That Created a New All Time High Today
Companies with Market Capital more than 20,000 Crores| Stock | Close | New All-Time High (ATH) | Previous ATH | Previous ATH Date |
|---|---|---|---|---|
| Alembic Pharma | 1175.40 (+8.33%) | 1192.94 (+%) | Thu 01 Jan 1970 | |
| BASF | 5898.35 (+4.08%) | 5933.89 (+%) | Thu 01 Jan 1970 | |
| Dr Reddy Lab | 6820.14 (-0.66%) | 6938.89 (+%) | Thu 01 Jan 1970 | |
| Federal Bank | 201.23 (+1.65%) | 204.00 (+%) | Thu 01 Jan 1970 | |
| Glenmark Pharma | 1425.69 (+0.05%) | 1447.80 (+%) | Thu 01 Jan 1970 |
Top Mid Cap Stocks That Created a New All Time High Today
Companies with Market Capital between 5,000 Crores to 20,000 Crores| Stock | Close | New All-Time High (ATH) | Previous ATH | Previous ATH Date |
|---|---|---|---|---|
| Ashoka Buildcon | 259.79 (+7.98%) | 263.00 (+%) | Thu 01 Jan 1970 | |
| Aditya Vision | 4855.75 (+4.98%) | 4915.00 (+%) | Thu 01 Jan 1970 | |
| Blue Jet Healthcare | 440.39 (+0.15%) | 467.95 (+%) | Thu 01 Jan 1970 | |
| CMS Info Systems | 558.15 (+3.78%) | 563.75 (+%) | Thu 01 Jan 1970 | |
| DOMS Industries | 2494.00 (+8.49%) | 2539.44 (+37.56%) | 1846.00 | Mon 01 Apr 2024 |
Top Small Cap Stocks That Created a New All Time High Today
Companies with Market Capital less than 5,000 Crores| Stock | Close | New All-Time High (ATH) | Previous ATH | Previous ATH Date |
|---|---|---|---|---|
| Ace Software Exports | 334.14 (+1.99%) | 334.14 (+122.34%) | 150.28 | Mon 01 Apr 2024 |
| Agri-tech | 281.04 (+19.99%) | 281.04 (+%) | Thu 01 Jan 1970 | |
| Ahmedabad Steelcraft | 144.14 (+1.98%) | 144.14 (+%) | Thu 01 Jan 1970 | |
| Associated Alcohols | 762.25 (+12.45%) | 770.95 (+%) | Thu 01 Jan 1970 | |
| Antony Waste Handling | 789.34 (+13.68%) | 829.00 (+%) | Thu 01 Jan 1970 |


