Home / Mon 24 Jun 2024 Market Recap
24 Jun 2024: Nifty closes at ₹23,547.69 (+0.4%). Top gainers: Mahindra & Mahindra, Power Grid, Sun Pharma. Explore top performers & stocks to watch tomorrow!
Show Table of Contents
Table of Contents
- 1: Top Indices Performance Overview
- 2: Nifty 50 Performance Overview
- 2.1: Nifty 50 Top Gainers
- 2.2: Nifty 50 Top Losers
- 2.3: Nifty 50 Stocks To Watch for Tomorrow
- 2.3.1: ➲ ICICI BANK (Bullish Pattern)
- 2.3.2: ➲ Bajaj Finance (Bearish Trend)
- 3: Nifty 500 Performance Overview
- 3.1: Nifty 500 Top Gainers
- 3.2: Nifty 500 Top Losers
- 3.3: Nifty 51 to 500 Stocks To Watch for Tomorrow
- 3.3.1: Mahindra Holidays & Resorts: A Bullish Outlook
- 3.3.2: ➲ Abbott (Bearish Pattern)
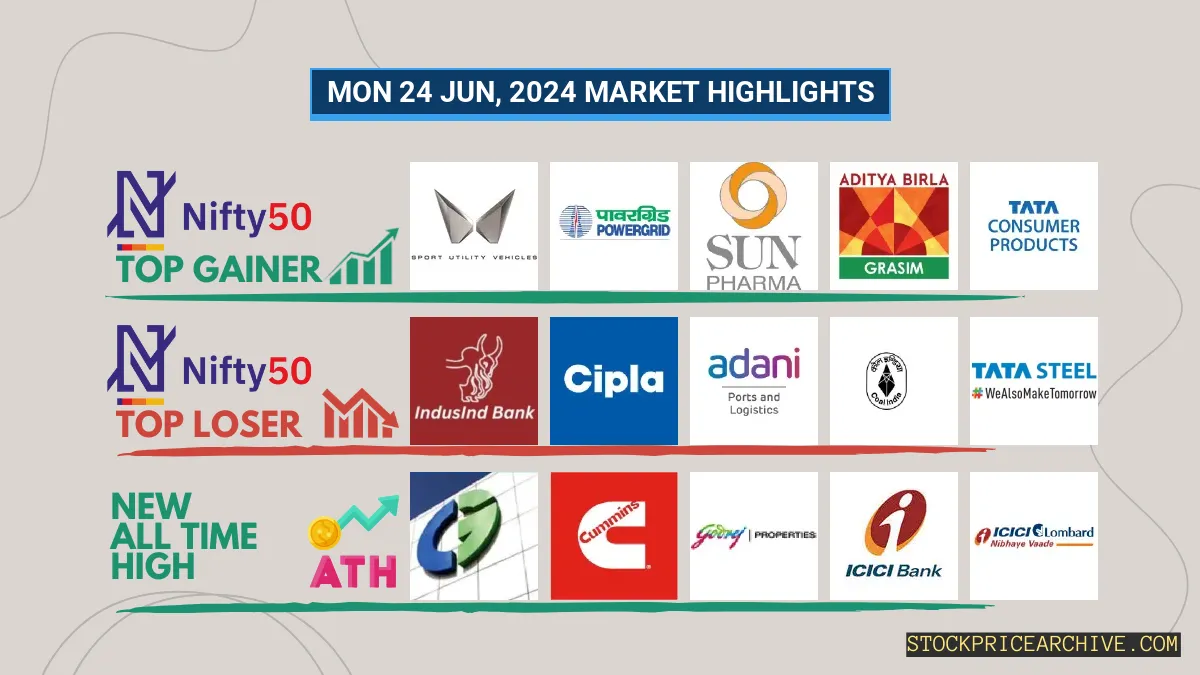
- 4: Top Stocks That Created a New All Time High Today
- 4.1: Top Large Cap Stocks That Created a New All Time High Today
- 4.2: Top Mid Cap Stocks That Created a New All Time High Today
- 4.3: Top Small Cap Stocks That Created a New All Time High Today
Top Indices Performance Overview
| Stock | Close | Range |
|---|---|---|
| NIFTY 50 | ₹23,547.69 (0.4%) | ₹23,351.05 – ₹23,556.5 |
| NIFTY BANK | ₹51,709.64 (0.29%) | ₹51,140.89 – ₹51,780.75 |
| NIFTY FIN SERVICE | ₹23,071.44 (0.34%) | ₹22,811.44 – ₹23,096.8 |
| NIFTY IT | ₹35132 (-0.2%) | ₹34,928.5 – ₹35282 |
| NIFTY AUTO | ₹25,346.65 (1.01%) | ₹24,862.15 – ₹25,350.75 |
| NIFTY ENERGY | ₹40,513.44 (0.13%) | ₹40,089.69 – ₹40,589.19 |
Nifty 50 Performance Overview
The Nifty 50 kicked off the day at ₹23,378.59, showcasing a bit of a rollercoaster ride. It dipped to a low of ₹23,351.05 before rallying to a high of ₹23,556.5. By the closing bell, it settled at ₹23,547.69, a positive 0.4% gain for the session.
Let’s take a peek at the top gainers and losers, which played a key role in shaping the Nifty’s movement today.
Nifty 50 Top Gainers
| Stock | Close | Range |
|---|---|---|
| Mahindra & Mahindra | ₹2923 (2.92%) | ₹2816 – ₹2,923.25 |
| Power Grid | ₹333.2 (2.55%) | ₹322.75 – ₹334 |
| Sun Pharma | ₹1,496.19 (1.97%) | ₹1,475.05 – ₹1,502.4 |
| GRASIM | ₹2,514.5 (1.96%) | ₹2,447.35 – ₹2,521.75 |
| Tata Consumer Products | ₹1,103.94 (1.75%) | ₹1,077.25 – ₹1104 |
Nifty 50 Top Losers
| Stock | Close | Range |
|---|---|---|
| IndusInd Bank | ₹1,489.05 (-2.5%) | ₹1,478.34 – ₹1,508.8 |
| Cipla | ₹1,507.84 (-2.19%) | ₹1,502.05 – ₹1,519.69 |
| Adani Ports | ₹1,460.19 (-1.71%) | ₹1,450.25 – ₹1,479.55 |
| Coal India | ₹474.45 (-1.2%) | ₹472.04 – ₹479.5 |
| Tata Steel | ₹177.8 (-1.19%) | ₹175.13 – ₹178.89 |
Nifty 50 Stocks To Watch for Tomorrow
➲ ICICI BANK (Bullish Pattern)
- Performance Overview: ICICI BANK has been on a roll in the last 24 trading sessions! It closed higher than the previous day 14 times and closed lower 10 times.
- Recent Trend: ICICI BANK has been steadily gaining momentum, closing higher each day for the past 5 days, starting from Friday, June 14th, 2024.
- Returns: Investing ₹10,000 in ICICI BANK over the past 24 trading sessions would have brought you a nice 4.2% return, leaving you with ₹10,420.
- Financial Insight: ICICI BANK has been strong financially, generating a revenue of ₹1,58,217.15 Crore and a profit of ₹44,256.36 Crore over the past 12 months.
- As of Monday, June 24th, 2024, ICICI BANK has a Market Capital of ₹8,15,153.17 Crore.
- Summary: ICICI BANK is showing a strong bullish pattern, which is a good sign for investors. If you’re interested in seeing what the future might hold for ICICI BANK, check out these resources: ICICI BANK Target for Tomorrow and ICICI BANK Targets for 2024 & 2025.
ICICI BANK Financial Performance
| Metric | Value | Description |
|---|---|---|
| Market Capital | 8,15,153.17 Crore | Market valuation of ICICI BANK’s shares. |
| Revenue (TTM) | 1,58,217.15 Crore | Total revenue generated by ICICI BANK over the past twelve months. |
| Net Income (TTM) | +44,256.36 Crore | Net Profit or Loss after all the expenses over the past twelve months. |
| Operating Margin | 35.07% | Income from operations as a percentage of revenue, before taxes and interest. |
| Profit Margin | 27.97% | Net income as a percentage of revenue, after all expenses. |
| Revenue Growth (Quarterly) | +77.6% | Change in revenue compared to the previous quarter. |
| Earnings Growth (YOY Quarterly) | +18.5% | Change in earnings compared to the same quarter last year. |
| Debt-to-Equity (D/E) Ratio | 0.82 | Company’s total debt divided by total shareholder equity. |
| Total Debt | 2,07,427.99 Crore | Sum of ICICI BANK’s current & long-term financial obligations. |
| Total Cash | 1,62,768.9 Crore | Total amount of liquid funds available to ICICI BANK. |
| Beta | 0.85 | Beta is less than 1 indicating that the ICICI BANK’s price is less volatile than the market. |
➲ Bajaj Finance (Bearish Trend)
- Performance Snapshot: Over the last 24 trading days, Bajaj Finance has closed higher than the previous day 14 times, and lower 10 times.
- Recent Trend: Bajaj Finance has been on a downward trend for the past five days, closing lower each day since Friday, June 14th, 2024.
- Returns: In the past 24 trading sessions, Bajaj Finance has generated a 5.66% return. This means that an investment of ₹10,000 would have grown to ₹10,566.
- Financial Insights: Over the last 12 months, Bajaj Finance has generated revenue of ₹31,627.11 Crore and recorded a profit of ₹14,451.16 Crore.
- As of Monday, June 24th, 2024, Bajaj Finance has a Market Capitalization of ₹4,45,512.52 Crore.
- Summary: Bajaj Finance is currently exhibiting a bearish trend. We recommend investors monitor the stock closely, particularly focusing on the Bajaj Finance Target for Tomorrow and the Bajaj Finance Targets for 2024 & 2025.
Bajaj Finance Financial Performance
| Metric | Value | Description |
|---|---|---|
| Market Capital | 4,45,512.52 Crore | Market valuation of Bajaj Finance’s shares. |
| Revenue (TTM) | 31,627.11 Crore | Total revenue generated by Bajaj Finance over the past twelve months. |
| Net Income (TTM) | +14,451.16 Crore | Net Profit or Loss after all the expenses over the past twelve months. |
| Operating Margin | 60.7% | Income from operations as a percentage of revenue, before taxes and interest. |
| Profit Margin | 45.69% | Net income as a percentage of revenue, after all expenses. |
| Revenue Growth (Quarterly) | +20.8% | Change in revenue compared to the previous quarter. |
| Earnings Growth (YOY Quarterly) | +21.1% | Change in earnings compared to the same quarter last year. |
| Debt-to-Equity (D/E) Ratio | 304.05 | Company’s total debt divided by total shareholder equity. |
| Total Debt | 2,33,197.03 Crore | Sum of Bajaj Finance’s current & long-term financial obligations. |
| Total Cash | 10,651.85 Crore | Total amount of liquid funds available to Bajaj Finance. |
| Beta | 1.01 | Beta is greater than 1 indicating that the Bajaj Finance’s price is more volatile than the market. |
Nifty 500 Performance Overview
The Nifty 500 started the day at ₹22,146.09. It had a bit of a roller coaster ride, dipping to a low of ₹22,073.75 and soaring to a high of ₹22,309.05. By the closing bell, it ended the session on a positive note, settling at ₹22,299.15, a +0.28% gain for the day.
The performance of the day was largely influenced by the top gainers and losers, which you can find in the table below. Let’s see how they shape up tomorrow!
Nifty 500 Top Gainers
| Stock | Close | Range |
|---|---|---|
| Bombay Burmah Trading Corp | ₹2,014.4 (19.62%) | ₹1,709.75 – ₹2,020.65 |
| Route Mobile | ₹1,739.94 (13.73%) | ₹1,510.4 – ₹1,796.55 |
| Bajaj Holdings | ₹8,724.79 (6.05%) | ₹8,305.09 – ₹8,986.7 |
| Brigade Enterprises | ₹1441 (6.02%) | ₹1329 – ₹1,445.55 |
| Tube Investments of India | ₹4210 (5.69%) | ₹3955 – ₹4358 |
Nifty 500 Top Losers
| Stock | Close | Range |
|---|---|---|
| Fertilisers & Chemicals Travancore | ₹1021 (-10%) | ₹1021 – ₹1,100.65 |
| RCF | ₹194.19 (-6.55%) | ₹192.02 – ₹204.3 |
| Ujjivan Small Finance Bank | ₹45.95 (-4.99%) | ₹44.82 – ₹46.95 |
| C.E. Info Systems | ₹2,408.89 (-4.85%) | ₹2,391.3 – ₹2,544.89 |
| Swan Energy | ₹625.5 (-4.78%) | ₹624 – ₹634.45 |
Nifty 51 to 500 Stocks To Watch for Tomorrow
Mahindra Holidays & Resorts: A Bullish Outlook
- Performance Snapshot: Over the past 24 trading days, Mahindra Holidays & Resorts has closed higher 17 times and lower 7 times.
- Recent Trend: This stock has been on a roll, closing higher for the last 9 consecutive trading days, starting on Monday, June 10, 2024.
- Returns: In the last 24 trading sessions, Mahindra Holidays & Resorts has delivered a strong 18.67% return. This means that an investment of ₹10,000 would have grown to ₹11,867.
- Financial Highlights: Over the past year, Mahindra Holidays & Resorts has generated impressive revenue of ₹2,704.59 Crore and achieved a profit of ₹115.52 Crore.
- As of Monday, June 24, 2024, Mahindra Holidays & Resorts boasts a market capitalization of ₹9,569.98 Crore.
- Summary: Mahindra Holidays & Resorts is displaying a robust bullish trend. Investors might want to keep a close eye on its price movements for potential short-term and long-term growth opportunities. Check out Mahindra Holidays & Resorts Target for Tomorrow and Mahindra Holidays & Resorts Targets for 2024 & 2025.
Mahindra Holidays & Resorts Financial Performance
| Metric | Value | Description |
|---|---|---|
| Market Capital | 9,569.98 Crore | Market valuation of Mahindra Holidays & Resorts’s shares. |
| Revenue (TTM) | 2,704.59 Crore | Total revenue generated by Mahindra Holidays & Resorts over the past twelve months. |
| Net Income (TTM) | +115.52 Crore | Net Profit or Loss after all the expenses over the past twelve months. |
| Operating Margin | 12.71% | Income from operations as a percentage of revenue, before taxes and interest. |
| Profit Margin | 4.27% | Net income as a percentage of revenue, after all expenses. |
| Revenue Growth (Quarterly) | +12.4% | Change in revenue compared to the previous quarter. |
| Earnings Growth (YOY Quarterly) | +46% | Change in earnings compared to the same quarter last year. |
| Debt-to-Equity (D/E) Ratio | 513.39 | Company’s total debt divided by total shareholder equity. |
| Total Debt | 2,738.28 Crore | Sum of Mahindra Holidays & Resorts’s current & long-term financial obligations. |
| Total Cash | 942.25 Crore | Total amount of liquid funds available to Mahindra Holidays & Resorts. |
| Beta | 0.16 | Beta is less than 1 indicating that the Mahindra Holidays & Resorts’s price is less volatile than the market. |
➲ Abbott (Bearish Pattern)
- Performance Overview: Over the last 24 trading sessions, Abbott has closed lower 14 times and higher 10 times.
- Recent Trend: Abbott has been on a downward trend for the past 6 days, with no gains since Thursday, June 13, 2024.
- Returns: In the past 24 trading sessions, Abbott provided a modest 0.6% return. This means that if you invested ₹10,000, you would have earned ₹60.
- Financial Insight: Over the past 12 months, Abbott generated a revenue of ₹5,848.9 Crore and achieved a profit of ₹1,201.21 Crore.
- As of Monday, June 24, 2024, Abbott has a Market Capital of ₹57,056.07 Crore.
- Summary: Abbott’s recent performance suggests a bearish trend. Investors are encouraged to closely monitor the company’s progress, especially considering the Abbott Target for Tomorrow and Abbott Targets for 2024 & 2025.
Abbott Financial Performance
| Metric | Value | Description |
|---|---|---|
| Market Capital | 57,056.07 Crore | Market valuation of Abbott’s shares. |
| Revenue (TTM) | 5,848.9 Crore | Total revenue generated by Abbott over the past twelve months. |
| Net Income (TTM) | +1,201.21 Crore | Net Profit or Loss after all the expenses over the past twelve months. |
| Operating Margin | 21.64% | Income from operations as a percentage of revenue, before taxes and interest. |
| Profit Margin | 20.53% | Net income as a percentage of revenue, after all expenses. |
| Revenue Growth (Quarterly) | +7.5% | Change in revenue compared to the previous quarter. |
| Earnings Growth (YOY Quarterly) | +24% | Change in earnings compared to the same quarter last year. |
| Debt-to-Equity (D/E) Ratio | 2.25 | Company’s total debt divided by total shareholder equity. |
| Total Debt | 83.23 Crore | Sum of Abbott’s current & long-term financial obligations. |
| Total Cash | 2,134.48 Crore | Total amount of liquid funds available to Abbott. |
| Beta | 0.07 | Beta is less than 1 indicating that the Abbott’s price is less volatile than the market. |
Top Stocks That Created a New All Time High Today
Top Large Cap Stocks That Created a New All Time High Today
Companies with Market Capital more than 20,000 Crores| Stock | Close | New All-Time High (ATH) | Previous ATH | Previous ATH Date |
|---|---|---|---|---|
| BASF | 5277.35 (+0.78%) | 5377.39 (+%) | Thu 01 Jan 1970 | |
| Brigade Enterprises | 1441.00 (+6.02%) | 1445.55 (+%) | Thu 01 Jan 1970 | |
| CG Power | 707.00 (+3.92%) | 735.00 (+%) | Thu 01 Jan 1970 | |
| Cummins India | 4036.89 (+3.51%) | 4090.35 (+25.36%) | 3262.80 | Wed 24 Apr 2024 |
| Elgi Equipments | 764.90 (+3.88%) | 798.50 (+%) | Thu 01 Jan 1970 |
Top Mid Cap Stocks That Created a New All Time High Today
Companies with Market Capital between 5,000 Crores to 20,000 Crores| Stock | Close | New All-Time High (ATH) | Previous ATH | Previous ATH Date |
|---|---|---|---|---|
| Asahi Glass | 709.34 (+4.63%) | 718.00 (+%) | Thu 01 Jan 1970 | |
| Aditya Vision | 4400.00 (+2.63%) | 4449.89 (+%) | Thu 01 Jan 1970 | |
| Elecon Engineering | 1323.94 (+1.19%) | 1380.00 (+15.19%) | 1197.94 | Fri 19 Apr 2024 |
| Eris Lifesciences | 1040.19 (-0.26%) | 1066.90 (+%) | Thu 01 Jan 1970 | |
| Gabriel India | 433.25 (+2.72%) | 445.00 (+%) | Thu 01 Jan 1970 |
Top Small Cap Stocks That Created a New All Time High Today
Companies with Market Capital less than 5,000 Crores| Stock | Close | New All-Time High (ATH) | Previous ATH | Previous ATH Date |
|---|---|---|---|---|
| The First Custodian Fund | 141.22 (+4.99%) | 141.22 (+%) | Thu 01 Jan 1970 | |
| 20 Microns | 222.00 (+3.84%) | 224.99 (+%) | Thu 01 Jan 1970 | |
| Aayush Food and Herbs | 305.50 (+2.51%) | 305.95 (+26.24%) | 242.35 | Thu 25 Apr 2024 |
| ADC India Communications | 1993.09 (+17.94%) | 2027.75 (+%) | Thu 01 Jan 1970 | |
| Ahmedabad Steelcraft | 95.40 (+1.99%) | 95.40 (+%) | Thu 01 Jan 1970 |