Home / Wed 26 Jun 2024 Market Recap
26 Jun 2024: Nifty Closes at ₹23,840.25 (+0.5%), ICICI Bank & Reliance Industries Shine. Cipla Faces Headwinds
Show Table of Contents
Table of Contents
- 1: Top Indices Performance Overview
- 2: Nifty 50 Performance Overview
- 2.1: Nifty 50 Top Gainers
- 2.2: Nifty 50 Top Losers
- 2.3: Nifty 50 Stocks To Watch for Tomorrow
- 2.3.1: ICICI BANK (Bullish Pattern)
- 2.3.2: Cipla (Bearish Pattern)
- 3: Nifty 500 Performance Overview
- 3.1: Nifty 500 Top Gainers
- 3.2: Nifty 500 Top Losers
- 3.3: Nifty 51 to 500 Stocks To Watch for Tomorrow
- 3.3.1: Samvardhana Motherson: A Look at its Recent Performance
- 3.3.2: ➲ LIC (Bearish Pattern)
- 4: Top Stocks That Created a New All Time High Today
- 4.1: Top Large Cap Stocks That Created a New All Time High Today
- 4.2: Top Mid Cap Stocks That Created a New All Time High Today
- 4.3: Top Small Cap Stocks That Created a New All Time High Today
Top Indices Performance Overview
| Stock | Close | Range |
|---|---|---|
| NIFTY 50 | ₹23,840.25 (0.5%) | ₹23,670.44 – ₹23,889.9 |
| NIFTY BANK | ₹52,694.5 (0.16%) | ₹52,373.69 – ₹52,988.3 |
| NIFTY FIN SERVICE | ₹23,518.44 (0.03%) | ₹23,402.94 – ₹23,638.55 |
| NIFTY IT | ₹35,406.55 (-0.06%) | ₹35336 – ₹35,593.94 |
| NIFTY AUTO | ₹25,018.9 (-0.92%) | ₹24,999.59 – ₹25,293.8 |
| NIFTY ENERGY | ₹40,822.6 (1.4%) | ₹40,145.55 – ₹40,883.6 |
Nifty 50 Performance Overview
The Nifty 50 kicked off the day at ₹23,739.44, showing some lively trading throughout the session. It touched a low of ₹23,670.44 and a high of ₹23,889.9 before closing at ₹23,840.25, a +0.5% gain for the day.
The top gainers and losers helped shape the Nifty 50’s performance today. Take a look at the table below for a closer look at these movers.
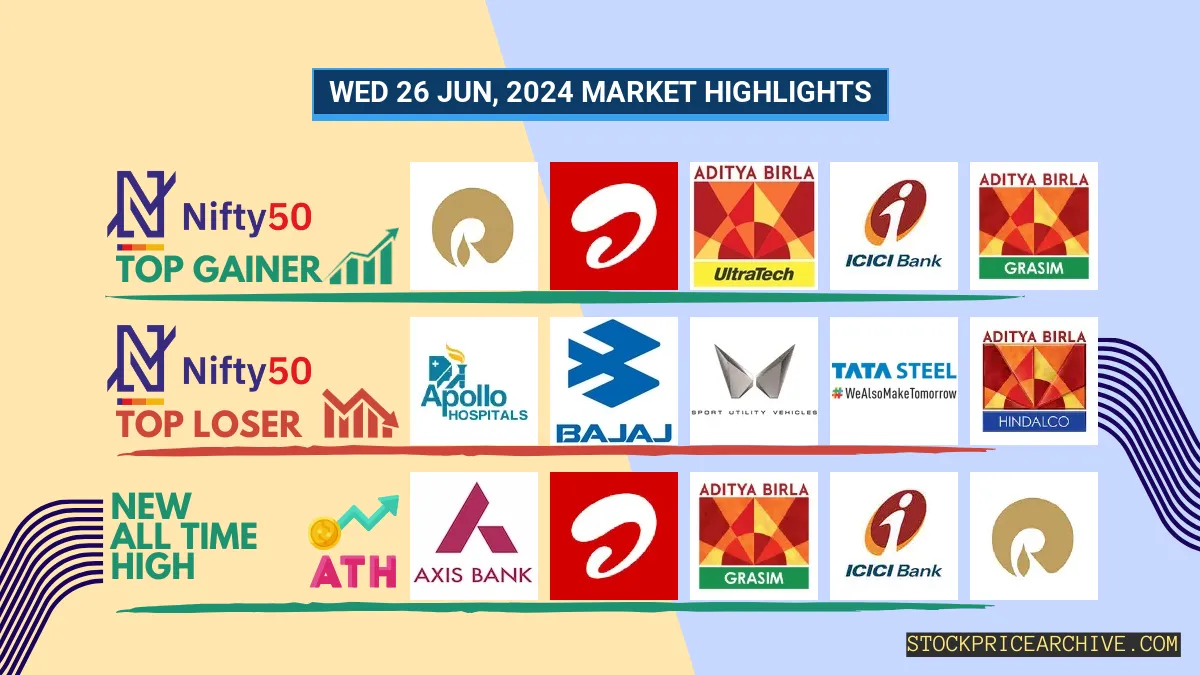
Nifty 50 Top Gainers
| Stock | Close | Range |
|---|---|---|
| Reliance Industries | ₹3,022.25 (3.91%) | ₹2,890.25 – ₹3,037.94 |
| Bharti Airtel | ₹1,459.5 (3.14%) | ₹1,408.94 – ₹1,479.94 |
| UltraTech Cement | ₹11,143.09 (2.73%) | ₹10903 – ₹11261 |
| ICICI BANK | ₹1218 (1.67%) | ₹1,193.83 – ₹1,222.83 |
| GRASIM | ₹2,552.25 (1.4%) | ₹2,509.05 – ₹2564 |
Nifty 50 Top Losers
| Stock | Close | Range |
|---|---|---|
| Apollo Hospitals | ₹6,136.95 (-2.52%) | ₹6125 – ₹6,285.64 |
| Bajaj Auto | ₹9,474.65 (-1.92%) | ₹9,441.5 – ₹9,660.29 |
| Mahindra & Mahindra | ₹2,856.75 (-1.81%) | ₹2,844.89 – ₹2,906.94 |
| Tata Steel | ₹172.8 (-1.64%) | ₹171.84 – ₹176 |
| Hindalco | ₹674.7 (-1.58%) | ₹671.34 – ₹683.54 |
Nifty 50 Stocks To Watch for Tomorrow
ICICI BANK (Bullish Pattern)
- Performance Overview: ICICI BANK has seen some exciting movement in the last 26 trading days. It closed higher than the previous day 16 times and finished lower 10 times.
- Recent Trend: ICICI BANK has been on a roll! It’s been on a 7-day green streak, showing consistent gains since Friday, June 14th, 2024.
- Returns: ICICI BANK delivered a strong 8.53% return over the past 26 trading days. This means that if you had invested ₹10,000, you’d be looking at a profit of ₹853!
- Financial Insight: ICICI BANK has been performing well financially. In the past year, it generated a revenue of ₹1,58,217.15 Crore and a profit of ₹44,256.36 Crore.
- As of Wednesday, June 26th, 2024, ICICI BANK has a Market Capital of ₹8,15,153.17 Crore.
- Summary: ICICI BANK is showing strong signs of bullishness. It’s a good idea to keep a close eye on its price movements to see where it might head next. For those interested in potential short-term and long-term growth prospects, check out these resources: ICICI BANK Target for Tomorrow and ICICI BANK Targets for 2024 & 2025.
ICICI BANK Financial Performance
| Metric | Value | Description |
|---|---|---|
| Market Capital | 8,15,153.17 Crore | Market valuation of ICICI BANK’s shares. |
| Revenue (TTM) | 1,58,217.15 Crore | Total revenue generated by ICICI BANK over the past twelve months. |
| Net Income (TTM) | +44,256.36 Crore | Net Profit or Loss after all the expenses over the past twelve months. |
| Operating Margin | 35.07% | Income from operations as a percentage of revenue, before taxes and interest. |
| Profit Margin | 27.97% | Net income as a percentage of revenue, after all expenses. |
| Revenue Growth (Quarterly) | +77.6% | Change in revenue compared to the previous quarter. |
| Earnings Growth (YOY Quarterly) | +18.5% | Change in earnings compared to the same quarter last year. |
| Debt-to-Equity (D/E) Ratio | 0.82 | Company’s total debt divided by total shareholder equity. |
| Total Debt | 2,07,427.99 Crore | Sum of ICICI BANK’s current & long-term financial obligations. |
| Total Cash | 1,62,768.9 Crore | Total amount of liquid funds available to ICICI BANK. |
| Beta | 0.85 | Beta is less than 1 indicating that the ICICI BANK’s price is less volatile than the market. |
Cipla (Bearish Pattern)
- Performance Overview: In the last 26 trading sessions, Cipla has closed lower than the previous day 12 times and higher 14 times.
- Recent Trend: Cipla has been on a 6-day losing streak, with no gains since Tuesday, June 18, 2024.
- Returns: Cipla has provided a 4.89% return over the last 26 trading sessions. This means an investment of ₹10,000 would have grown to ₹10,489.
- Financial Insight: Over the past 12 months, Cipla has generated a revenue of ₹25,446.62 Crore and created a profit of ₹4,121.55 Crore.
- As of Wednesday, June 26, 2024, Cipla has a Market Capital of ₹1,24,717.1 Crore.
- Summary: Cipla is currently experiencing a bearish trend. We recommend keeping a close eye on its performance, especially looking at the Cipla Target for Tomorrow and Cipla Targets for 2024 & 2025.
Cipla Financial Performance
| Metric | Value | Description |
|---|---|---|
| Market Capital | 1,24,717.1 Crore | Market valuation of Cipla’s shares. |
| Revenue (TTM) | 25,446.62 Crore | Total revenue generated by Cipla over the past twelve months. |
| Net Income (TTM) | +4,121.55 Crore | Net Profit or Loss after all the expenses over the past twelve months. |
| Operating Margin | 16.89% | Income from operations as a percentage of revenue, before taxes and interest. |
| Profit Margin | 16.19% | Net income as a percentage of revenue, after all expenses. |
| Revenue Growth (Quarterly) | +9.7% | Change in revenue compared to the previous quarter. |
| Earnings Growth (YOY Quarterly) | +78.6% | Change in earnings compared to the same quarter last year. |
| Debt-to-Equity (D/E) Ratio | 2.08 | Company’s total debt divided by total shareholder equity. |
| Total Debt | 559.41 Crore | Sum of Cipla’s current & long-term financial obligations. |
| Total Cash | 5,681.97 Crore | Total amount of liquid funds available to Cipla. |
| Beta | 0.36 | Beta is less than 1 indicating that the Cipla’s price is less volatile than the market. |
Nifty 500 Performance Overview
The Nifty 500 kicked off the day at ₹22,379.5, showing some lively movement throughout the session. It dipped to a low of ₹22,309.5 before climbing to a high of ₹22,464.84. The index closed the day at ₹22,436.8, up 0.29% for the day.
Let’s take a peek at the top gainers and losers that helped shape the Nifty’s journey today.
Nifty 500 Top Gainers
| Stock | Close | Range |
|---|---|---|
| India Cements | ₹262.62 (14.49%) | ₹230.5 – ₹269.5 |
| CESC | ₹167.98 (10.9%) | ₹151.46 – ₹170 |
| Hitachi Energy | ₹12612 (10.48%) | ₹11493 – ₹13,058.75 |
| Raymond | ₹3004 (8.08%) | ₹2,783.55 – ₹3030 |
| IIFL Finance | ₹493.54 (7.26%) | ₹459 – ₹497.29 |
Nifty 500 Top Losers
| Stock | Close | Range |
|---|---|---|
| C.E. Info Systems | ₹2277 (-5.68%) | ₹2262 – ₹2,398.69 |
| Mahindra Holidays & Resorts | ₹465 (-4.01%) | ₹464.89 – ₹484.39 |
| RattanIndia Enterprises | ₹83.1 (-3.6%) | ₹82.9 – ₹86.2 |
| MCX of India | ₹3,805.05 (-3.47%) | ₹3797 – ₹3,955.85 |
| Westlife Development | ₹849.9 (-3.41%) | ₹838.84 – ₹898 |
Nifty 51 to 500 Stocks To Watch for Tomorrow
Samvardhana Motherson: A Look at its Recent Performance
- Performance Overview: Over the last 26 trading days, Samvardhana Motherson has closed higher 21 times and lower 5 times. That’s a pretty impressive track record!
- Recent Trend: Samvardhana Motherson is on a hot streak! It has closed higher for the past 10 days straight, with the last red day being Tuesday, June 11th, 2024.
- Returns: In those 26 trading sessions, Samvardhana Motherson delivered a strong 49.42% return. Imagine investing ₹10,000 – you’d have ₹14,942 today!
- Financial Insight: Samvardhana Motherson has been doing well financially, generating ₹97,779.41 Crore in revenue and earning a profit of ₹2,716.19 Crore over the past year.
- As of Wednesday, June 26th, 2024, Samvardhana Motherson has a market capitalization of ₹1,28,432.2 Crore.
- Summary: Samvardhana Motherson is showing strong signs of bullish momentum. Investors are keeping a close eye on its price movements, looking for both short-term and long-term growth opportunities. Want to see what experts are predicting? Check out Samvardhana Motherson Target for Tomorrow and Samvardhana Motherson Targets for 2024 & 2025.
Samvardhana Motherson Financial Performance
| Metric | Value | Description |
|---|---|---|
| Market Capital | 1,28,432.2 Crore | Market valuation of Samvardhana Motherson’s shares. |
| Revenue (TTM) | 97,779.41 Crore | Total revenue generated by Samvardhana Motherson over the past twelve months. |
| Net Income (TTM) | +2,716.19 Crore | Net Profit or Loss after all the expenses over the past twelve months. |
| Operating Margin | 6.9% | Income from operations as a percentage of revenue, before taxes and interest. |
| Profit Margin | 2.77% | Net income as a percentage of revenue, after all expenses. |
| Revenue Growth (Quarterly) | +21% | Change in revenue compared to the previous quarter. |
| Earnings Growth (YOY Quarterly) | +109.8% | Change in earnings compared to the same quarter last year. |
| Debt-to-Equity (D/E) Ratio | 70.6 | Company’s total debt divided by total shareholder equity. |
| Total Debt | 19,921.83 Crore | Sum of Samvardhana Motherson’s current & long-term financial obligations. |
| Total Cash | 7,084.38 Crore | Total amount of liquid funds available to Samvardhana Motherson. |
| Beta | 1.53 | Beta is greater than 1 indicating that the Samvardhana Motherson’s price is more volatile than the market. |
➲ LIC (Bearish Pattern)
- Performance Overview: Over the past 26 trading sessions, LIC has seen a mixed performance, closing in the red 14 times and in the green 12 times.
- Recent Trend: LIC has been on a 7-day losing streak, with no gains since Friday, June 14th, 2024.
- Returns: LIC delivered a 2.45% return over the last 26 trading sessions. That means if you had invested ₹10,000, your investment would have grown to ₹10,245.
- Financial Insight: In the past 12 months, LIC generated a revenue of ₹8,56,354.08 Crore and earned a profit of ₹42,329.76 Crore.
- As of Wednesday, June 26th, 2024, LIC has a Market Capital of ₹6,47,648.4 Crore.
- Summary: LIC is currently going through a bearish phase. We recommend investors carefully monitor its performance, particularly the LIC Target for Tomorrow and LIC Targets for 2024 & 2025.
LIC Financial Performance
| Metric | Value | Description |
|---|---|---|
| Market Capital | 6,47,648.4 Crore | Market valuation of LIC’s shares. |
| Revenue (TTM) | 8,56,354.08 Crore | Total revenue generated by LIC over the past twelve months. |
| Net Income (TTM) | +42,329.76 Crore | Net Profit or Loss after all the expenses over the past twelve months. |
| Operating Margin | 6.27% | Income from operations as a percentage of revenue, before taxes and interest. |
| Profit Margin | 4.94% | Net income as a percentage of revenue, after all expenses. |
| Revenue Growth (Quarterly) | +26.3% | Change in revenue compared to the previous quarter. |
| Earnings Growth (YOY Quarterly) | +72.09% | Change in earnings compared to the same quarter last year. |
| Total Cash | 41,824.46 Crore | Total amount of liquid funds available to LIC. |
| Beta | 0.6 | Beta is less than 1 indicating that the LIC’s price is less volatile than the market. |
Top Stocks That Created a New All Time High Today
Top Large Cap Stocks That Created a New All Time High Today
Companies with Market Capital more than 20,000 Crores| Stock | Close | New All-Time High (ATH) | Previous ATH | Previous ATH Date |
|---|---|---|---|---|
| ARE&M | 1690.00 (+2.42%) | 1775.94 (+47.99%) | 1200.00 | Mon 01 Apr 2024 |
| Axis Bank | 1283.55 (+0.95%) | 1292.94 (+%) | Thu 01 Jan 1970 | |
| Bharti Airtel | 1459.50 (+3.14%) | 1479.94 (+9.54%) | 1351.00 | Tue 23 Apr 2024 |
| Bharti Hexacom | 1257.15 (+8.29%) | 1368.59 (+%) | Thu 01 Jan 1970 | |
| Bosch | 34149.39 (+0.98%) | 34426.89 (+10.51%) | 31150.00 | Wed 27 Mar 2024 |
Top Mid Cap Stocks That Created a New All Time High Today
Companies with Market Capital between 5,000 Crores to 20,000 Crores| Stock | Close | New All-Time High (ATH) | Previous ATH | Previous ATH Date |
|---|---|---|---|---|
| Amara Raja Batteries | 1664.84 (+1.13%) | 1765.30 (+56.49%) | 1128.00 | Tue 25 Aug 2015 |
| Aditya Vision | 4525.00 (+2.38%) | 4545.00 (+%) | Thu 01 Jan 1970 | |
| Can Fin Homes | 901.25 (+0.18%) | 912.65 (+%) | Thu 01 Jan 1970 | |
| Gabriel India | 485.89 (+1.99%) | 498.79 (+%) | Thu 01 Jan 1970 | |
| Granules India | 502.20 (+2.95%) | 506.70 (+%) | Thu 01 Jan 1970 |
Top Small Cap Stocks That Created a New All Time High Today
Companies with Market Capital less than 5,000 Crores| Stock | Close | New All-Time High (ATH) | Previous ATH | Previous ATH Date |
|---|---|---|---|---|
| Aayush Food and Herbs | 306.00 (+0%) | 313.95 (+29.54%) | 242.35 | Thu 25 Apr 2024 |
| Ahmedabad Steelcraft | 99.24 (+1.99%) | 99.24 (+%) | Thu 01 Jan 1970 | |
| Alicon Castalloy | 1271.25 (-0.6%) | 1350.00 (+%) | Thu 01 Jan 1970 | |
| AMBO AGRITEC LIMITED | 88.00 (+1.14%) | 91.00 (+%) | Thu 01 Jan 1970 | |
| Amines & Plasticizers Ltd | 294.82 (+17.75%) | 300.45 (+%) | Thu 01 Jan 1970 |