Home / Thu 01 Aug 2024 Market Recap
01 Aug 2024: Nifty Closed at ₹25,010.9 (+0.23%), Coal India closing higher for the past 7 days straight & Granules India for past 9-days
Show Table of Contents
Table of Contents
- 1: Top Indices Performance Overview
- 2: Nifty 50 Performance Overview
- 2.1: Nifty 50 Top Gainers
- 2.2: Nifty 50 Top Losers
- 2.3: Nifty 50 Stocks To Watch for Tomorrow
- 2.3.1: Coal India: A Bullish Trend?
- 2.3.2: ➲ GRASIM (Showing Bearish Signs)
- 3: Nifty 500 Performance Overview
- 3.1: Nifty 500 Top Gainers
- 3.2: Nifty 500 Top Losers
- 3.3: Nifty 51 to 500 Stocks To Watch for Tomorrow
- 3.3.1: Granules India (Bullish Pattern)
- 3.3.2: ➲ Poly Medicure (Bearish Trend)
- 4: Top Stocks That Created a New All Time High Today
- 4.1: Top Large Cap Stocks That Created a New All Time High Today
- 4.2: Top Mid Cap Stocks That Created a New All Time High Today
- 4.3: Top Small Cap Stocks That Created a New All Time High Today
Top Indices Performance Overview
| Stock | Close | Range |
|---|---|---|
| NIFTY 50 | ₹25,010.9 (0.23%) | ₹24,956.4 – ₹25,078.3 |
| NIFTY BANK | ₹51564 (0.02%) | ₹51,456.19 – ₹51,877.14 |
| NIFTY FIN SERVICE | ₹23,435.84 (0.1%) | ₹23,387.65 – ₹23,550.65 |
| NIFTY IT | ₹40,646.05 (-0.51%) | ₹40,538.14 – ₹41035 |
| NIFTY AUTO | ₹26470 (-0.81%) | ₹26,357.94 – ₹26,932.84 |
| NIFTY ENERGY | ₹44,967.39 (1.99%) | ₹44,294.05 – ₹45,020.05 |
Nifty 50 Performance Overview
The Nifty 50 started the day at ₹25,030.94, showcasing a dynamic trading session. It dipped to a low of ₹24,956.4 before climbing to a high of ₹25,078.3. The index eventually settled at ₹25,010.9, marking a positive 0.23% gain for the day.
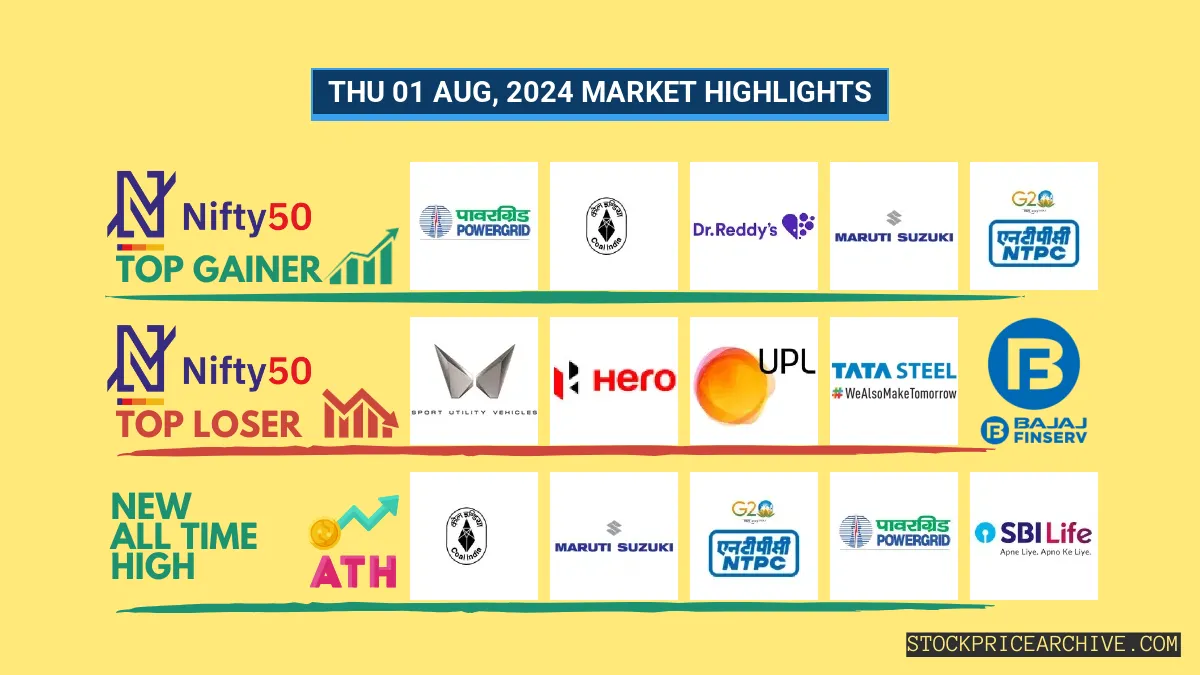
Nifty 50 Top Gainers
| Stock | Close | Range |
|---|---|---|
| Power Grid | ₹361.1 (3.7%) | ₹350.14 – ₹362.5 |
| Coal India | ₹540 (3.4%) | ₹530 – ₹542.25 |
| Dr Reddy Lab | ₹6,887.95 (2.03%) | ₹6,794.04 – ₹6,900.29 |
| Maruti Suzuki | ₹13,359.04 (1.85%) | ₹13112 – ₹13680 |
| NTPC | ₹423.45 (1.79%) | ₹415.6 – ₹424.35 |
Nifty 50 Top Losers
| Stock | Close | Range |
|---|---|---|
| Mahindra & Mahindra | ₹2,828.39 (-2.74%) | ₹2,820.1 – ₹2,926.5 |
| Hero MotoCorp | ₹5375 (-2.07%) | ₹5,326.04 – ₹5,460.54 |
| UPL | ₹560.45 (-2.03%) | ₹557.09 – ₹577 |
| Tata Steel | ₹163.06 (-1.38%) | ₹160.88 – ₹168.95 |
| Bajaj Finserv | ₹1631 (-1.26%) | ₹1,630.15 – ₹1659 |
Nifty 50 Stocks To Watch for Tomorrow
Coal India: A Bullish Trend?
- Performance Overview: Over the last 26 trading days, Coal India has closed higher 19 times and lower 7 times. This suggests a strong upward trend, indicating potential for growth.
- Recent Trend: Coal India has been on a winning streak, closing higher for the past 7 days straight, without a single day of decline since Tuesday, July 23rd, 2024. This continuous upward momentum suggests positive investor sentiment.
- Returns: In the last 26 trading sessions, Coal India has delivered a 14.83% return. This means that if you invested ₹10,000 during this period, you would have seen a gain of ₹1,482.99.
- Financial Insight: Over the past 12 months, Coal India has generated a revenue of ₹1,30,325.64 Crore and a profit of ₹37,402.28 Crore. These impressive financial results showcase the company’s strong performance.
- As of Thursday, August 1st, 2024, Coal India has a Market Capital of ₹3,14,206.79 Crore. This large market cap indicates a significant investor confidence in the company.
- Summary: Coal India’s recent performance reveals a positive, bullish trend. Investors are encouraged to monitor its price movements to determine their own short-term and long-term investment strategies: Checkout Coal India Target for Tomorrow and Coal India Targets for 2024 & 2025.
Coal India Financial Performance
| Metric | Value | Description |
|---|---|---|
| Market Capital | 3,14,206.79 Crore | Market valuation of Coal India’s shares. |
| Revenue (TTM) | 1,30,325.64 Crore | Total revenue generated by Coal India over the past twelve months. |
| Net Income (TTM) | +37,402.28 Crore | Net Profit or Loss after all the expenses over the past twelve months. |
| Operating Margin | 27.27% | Income from operations as a percentage of revenue, before taxes and interest. |
| Profit Margin | 28.69% | Net income as a percentage of revenue, after all expenses. |
| Revenue Growth (Quarterly) | -25.2% | Change in revenue compared to the previous quarter. |
| Earnings Growth (YOY Quarterly) | +56.89% | Change in earnings compared to the same quarter last year. |
| Debt-to-Equity (D/E) Ratio | 7.8 | Company’s total debt divided by total shareholder equity. |
| Total Debt | 6,523.02 Crore | Sum of Coal India’s current & long-term financial obligations. |
| Total Cash | 33,486.27 Crore | Total amount of liquid funds available to Coal India. |
| Beta | 0.27 | Beta is less than 1 indicating that the Coal India’s price is less volatile than the market. |
➲ GRASIM (Showing Bearish Signs)
- Performance Overview: Over the past 26 trading sessions, GRASIM’s stock price has closed higher on 13 days and lower on 13 days.
- Recent Trend: GRASIM has been on a downward trend for the past four days, with its stock price closing lower each day since Friday, July 26, 2024.
- Returns: In the last 26 trading days, GRASIM has delivered a 9.57% return. This means that if you had invested ₹10,000 in GRASIM during this period, your investment would now be worth ₹10,956.99.
- Financial Insight: In the past 12 months, GRASIM has generated revenue of ₹1,30,978.48 Crore and generated a profit of ₹5,624.48 Crore.
- As of Thursday, August 1, 2024, GRASIM has a Market Capital of ₹1,92,897.71 Crore.
- Summary: GRASIM is currently experiencing a bearish phase. It’s a good idea to keep a close eye on the stock’s performance in the coming days. You might want to check out GRASIM Target for Tomorrow and GRASIM Targets for 2024 & 2025 for more insights.
GRASIM Financial Performance
| Metric | Value | Description |
|---|---|---|
| Market Capital | 1,92,897.71 Crore | Market valuation of GRASIM’s shares. |
| Revenue (TTM) | 1,30,978.48 Crore | Total revenue generated by GRASIM over the past twelve months. |
| Net Income (TTM) | +5,624.48 Crore | Net Profit or Loss after all the expenses over the past twelve months. |
| Operating Margin | 17.41% | Income from operations as a percentage of revenue, before taxes and interest. |
| Profit Margin | 4.29% | Net income as a percentage of revenue, after all expenses. |
| Revenue Growth (Quarterly) | +12.7% | Change in revenue compared to the previous quarter. |
| Earnings Growth (YOY Quarterly) | +0.1% | Change in earnings compared to the same quarter last year. |
| Debt-to-Equity (D/E) Ratio | 100.1 | Company’s total debt divided by total shareholder equity. |
| Total Debt | 1,39,077.27 Crore | Sum of GRASIM’s current & long-term financial obligations. |
| Total Cash | 22,122.05 Crore | Total amount of liquid funds available to GRASIM. |
| Beta | 0.55 | Beta is less than 1 indicating that the GRASIM’s price is less volatile than the market. |
Nifty 500 Performance Overview
The Nifty 500 started the day at ₹23,608.94. It went through a bit of a roller coaster ride, hitting a low of ₹23,430.25 and a high of ₹23,637.3 before finishing the session at ₹23,510 (-0.09%).
Let’s take a look at the top gainers and losers that influenced the Nifty 500’s movement today.
Nifty 500 Top Gainers
| Stock | Close | Range |
|---|---|---|
| Ajanta Pharma | ₹2,790.35 (10.26%) | ₹2,666.39 – ₹2,812.1 |
| Firstsource Solutions | ₹300.39 (9.85%) | ₹273.64 – ₹309.04 |
| Capri Global | ₹224.5 (7.43%) | ₹209.3 – ₹228.5 |
| Hitachi Energy | ₹12,392.15 (6.76%) | ₹11,707.59 – ₹12,540.9 |
| PCBL | ₹346.85 (6.64%) | ₹324.29 – ₹359.79 |
Nifty 500 Top Losers
| Stock | Close | Range |
|---|---|---|
| Sonata Software | ₹664.15 (-9.87%) | ₹657.2 – ₹730 |
| KRBL | ₹294.75 (-7.45%) | ₹289.85 – ₹304.89 |
| Teamlease Services | ₹3,275.55 (-6.87%) | ₹3240 – ₹3,450.05 |
| Zee Entertainment | ₹141.77 (-4.64%) | ₹141 – ₹150.19 |
| Network18 Media & Investments | ₹93.66 (-4.63%) | ₹93.01 – ₹99.7 |
Nifty 51 to 500 Stocks To Watch for Tomorrow
Granules India (Bullish Pattern)
- Performance Overview: In the last 26 trading sessions, Granules India has closed in the green 17 times and in the red 9 times.
- Recent Trend: Granules India has been on a 9-day green streak, without a single day closing in the red since Friday, July 19, 2024.
- Returns: Granules India delivered a 28.82% return in the last 26 trading sessions. This means an investment of ₹10,000 would have grown to ₹12,882.
- Financial Insight: Over the past 12 months, Granules India has generated a revenue of ₹4,506.36 Crore and achieved a profit of ₹405.31 Crore.
- As of Thursday, August 1, 2024, Granules India has a Market Capital of ₹13,647.79 Crore.
- Summary: Granules India is exhibiting a strong bullish pattern. Investors should keep an eye on its price movements to capitalize on both short-term and long-term growth opportunities. Checkout Granules India Target for Tomorrow and Granules India Targets for 2024 & 2025.
Granules India Financial Performance
| Metric | Value | Description |
|---|---|---|
| Market Capital | 13,647.79 Crore | Market valuation of Granules India’s shares. |
| Revenue (TTM) | 4,506.36 Crore | Total revenue generated by Granules India over the past twelve months. |
| Net Income (TTM) | +405.31 Crore | Net Profit or Loss after all the expenses over the past twelve months. |
| Operating Margin | 17.58% | Income from operations as a percentage of revenue, before taxes and interest. |
| Profit Margin | 8.99% | Net income as a percentage of revenue, after all expenses. |
| Revenue Growth (Quarterly) | -1.71% | Change in revenue compared to the previous quarter. |
| Earnings Growth (YOY Quarterly) | +8.4% | Change in earnings compared to the same quarter last year. |
| Debt-to-Equity (D/E) Ratio | 40.77 | Company’s total debt divided by total shareholder equity. |
| Total Debt | 1,315.06 Crore | Sum of Granules India’s current & long-term financial obligations. |
| Total Cash | 381.1 Crore | Total amount of liquid funds available to Granules India. |
| Beta | 0.35 | Beta is less than 1 indicating that the Granules India’s price is less volatile than the market. |
➲ Poly Medicure (Bearish Trend)
- Performance Overview: Over the past 26 trading sessions, Poly Medicure has experienced more downturns than upswings, closing in red 17 times and in green 9 times.
- Recent Trend: Poly Medicure has been on a downward trend for the past 11 trading days, without closing in green since Tuesday, July 16, 2024.
- Returns: Over the last 26 trading days, Poly Medicure has yielded a -8.33% return. This means that an investment of ₹10,000 would have decreased to ₹9,167.
- Financial Insight: Over the last 12 months, Granules India has generated a revenue of ₹1,375.79 Crore and earned a profit of ₹258.25 Crore.
- As of Thursday, August 1, 2024, Granules India boasts a Market Capital of ₹17,404.89 Crore.
- Summary: Poly Medicure is currently in a bearish phase. Investors are advised to closely monitor its performance, especially considering the Poly Medicure Target for Tomorrow and Poly Medicure Targets for 2024 & 2025.
Poly Medicure Financial Performance
| Metric | Value | Description |
|---|---|---|
| Market Capital | 17,404.89 Crore | Market valuation of Poly Medicure’s shares. |
| Revenue (TTM) | 1,375.79 Crore | Total revenue generated by Poly Medicure over the past twelve months. |
| Net Income (TTM) | +258.25 Crore | Net Profit or Loss after all the expenses over the past twelve months. |
| Operating Margin | 21.26% | Income from operations as a percentage of revenue, before taxes and interest. |
| Profit Margin | 18.77% | Net income as a percentage of revenue, after all expenses. |
| Revenue Growth (Quarterly) | +23.2% | Change in revenue compared to the previous quarter. |
| Earnings Growth (YOY Quarterly) | +16.2% | Change in earnings compared to the same quarter last year. |
| Debt-to-Equity (D/E) Ratio | 11.84 | Company’s total debt divided by total shareholder equity. |
| Total Debt | 174.15 Crore | Sum of Poly Medicure’s current & long-term financial obligations. |
| Total Cash | 286.39 Crore | Total amount of liquid funds available to Poly Medicure. |
| Beta | 0.34 | Beta is less than 1 indicating that the Poly Medicure’s price is less volatile than the market. |
Top Stocks That Created a New All Time High Today
Top Large Cap Stocks That Created a New All Time High Today
Companies with Market Capital more than 20,000 Crores| Stock | Close | New All-Time High (ATH) | Previous ATH | Previous ATH Date |
|---|---|---|---|---|
| Affle | 1465.84 (-2.94%) | 1546.00 (+%) | Thu 01 Jan 1970 | |
| Ajanta Pharma | 2790.35 (+3.53%) | 2812.10 (+%) | Thu 01 Jan 1970 | |
| Aurobindo Pharma | 1434.19 (+0%) | 1440.94 (+%) | Thu 01 Jan 1970 | |
| Balkrishna Industries | 3345.85 (+0.67%) | 3375.00 (+%) | Thu 01 Jan 1970 | |
| BASF | 6140.60 (-1.57%) | 6441.25 (+%) | Thu 01 Jan 1970 |
Top Mid Cap Stocks That Created a New All Time High Today
Companies with Market Capital between 5,000 Crores to 20,000 Crores| Stock | Close | New All-Time High (ATH) | Previous ATH | Previous ATH Date |
|---|---|---|---|---|
| Akzo Nobel India | 3123.00 (+4.94%) | 3130.00 (+%) | Thu 01 Jan 1970 | |
| Black Box | 532.29 (+3.88%) | 537.90 (+%) | Thu 01 Jan 1970 | |
| Blue Jet Healthcare | 499.39 (+5.81%) | 515.00 (+%) | Thu 01 Jan 1970 | |
| ENTERO | 1260.00 (+5.36%) | 1263.00 (+%) | Thu 01 Jan 1970 | |
| Epigral | 1810.15 (+5.23%) | 1819.94 (+27.72%) | 1424.90 | Mon 22 Apr 2024 |
Top Small Cap Stocks That Created a New All Time High Today
Companies with Market Capital less than 5,000 Crores| Stock | Close | New All-Time High (ATH) | Previous ATH | Previous ATH Date |
|---|---|---|---|---|
| Abans Holdings | 576.20 (+1.3%) | 589.00 (+35.21%) | 435.60 | Wed 10 Apr 2024 |
| Ahmedabad Steelcraft | 162.14 (+1.98%) | 162.14 (+%) | Thu 01 Jan 1970 | |
| Bajaj Steel Industries | 1917.05 (+5.17%) | 1929.00 (+%) | Thu 01 Jan 1970 | |
| Bhilwara Spinners | 159.05 (-2.67%) | 177.05 (+%) | Thu 01 Jan 1970 | |
| Bits | 6.53 (+1.87%) | 6.53 (+%) | Thu 01 Jan 1970 |


