Home / Mon 29 Jul 2024 Market Recap
Nifty closed at ₹24,851.75 (+1.82%), with Bharat Petroleum & Divis Lab leading the charge!
Show Table of Contents
Table of Contents
- 1: Top Indices Performance Overview
- 2: Nifty 50 Performance Overview
- 2.1: Nifty 50 Top Gainers
- 2.2: Nifty 50 Top Losers
- 2.3: Nifty 50 Stocks To Watch for Tomorrow
- 2.3.1: Bharat Petroleum: A Closer Look at Recent Performance
- 2.3.2: ➲ Axis Bank (Bearish Pattern)
- 3: Nifty 500 Performance Overview
- 3.1: Nifty 500 Top Gainers
- 3.2: Nifty 500 Top Losers
- 3.3: Nifty 51 to 500 Stocks To Watch for Tomorrow
- 3.3.1: Ajanta Pharma (Bullish Pattern)
- 3.3.2: ➲ eClerx (Bearish Pattern)
- 4: Top Stocks That Created a New All Time High Today
- 4.1: Top Large Cap Stocks That Created a New All Time High Today
- 4.2: Top Mid Cap Stocks That Created a New All Time High Today
- 4.3: Top Small Cap Stocks That Created a New All Time High Today
Top Indices Performance Overview
| Stock | Close | Range |
|---|---|---|
| NIFTY IT | ₹40,820.1 (-0.39%) | ₹40,691.35 – ₹41,381.1 |
| NIFTY AUTO | ₹26,426.55 (0.66%) | ₹26,261.8 – ₹26,460.65 |
| NIFTY ENERGY | ₹43,438.69 (0.46%) | ₹43308 – ₹43,732.8 |
Nifty 50 Performance Overview
The Nifty 50 kicked off the day at ₹24,430.05, showing some initial volatility. It dipped to a low of ₹24,415.15 before rallying to a high of ₹24,860.05. The index ultimately closed at ₹24,851.75, marking a strong 1.82% gain for the day.
Let’s see which stocks were the key drivers behind this positive movement.
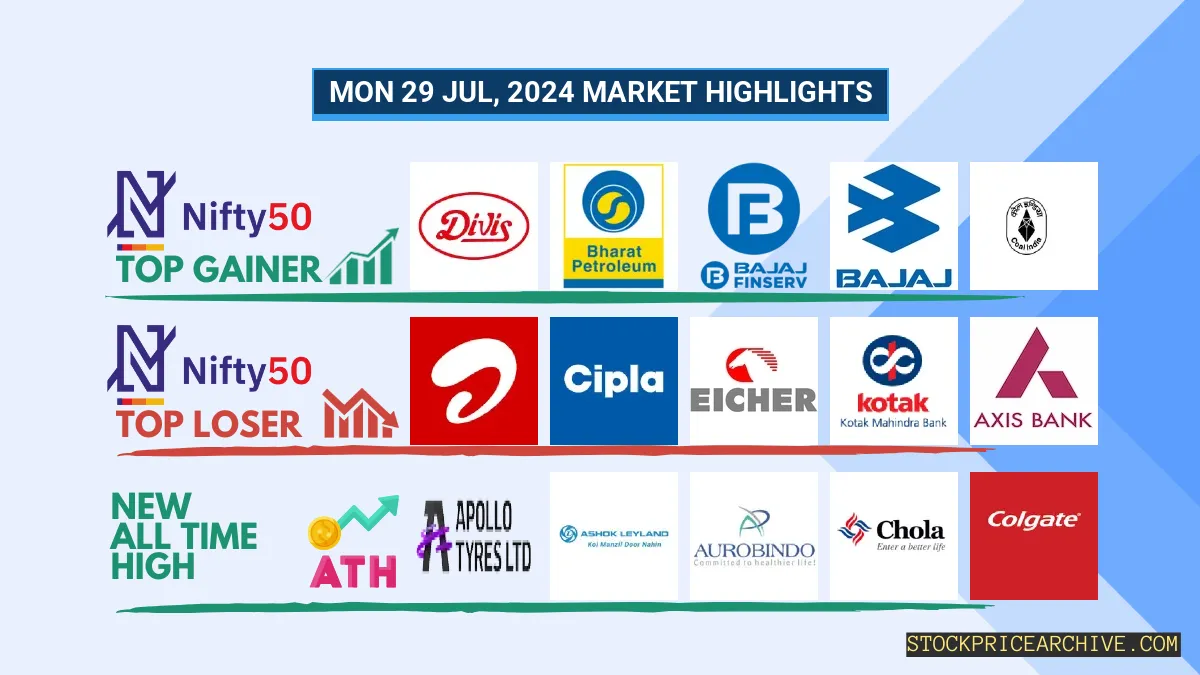
Nifty 50 Top Gainers
| Stock | Close | Range |
|---|---|---|
| Divis Lab | ₹4,923.85 (2.78%) | ₹4,771.7 – ₹4951 |
| Bharat Petroleum | ₹337.89 (2.76%) | ₹331.04 – ₹338.95 |
| Bajaj Finserv | ₹1,617.15 (1.93%) | ₹1,582.5 – ₹1625 |
| Bajaj Auto | ₹9,557.65 (0.68%) | ₹9509 – ₹9,621.04 |
| Coal India | ₹512.15 (0.45%) | ₹507.5 – ₹515.7 |
Nifty 50 Top Losers
| Stock | Close | Range |
|---|---|---|
| Bharti Airtel | ₹1,481.34 (-2.19%) | ₹1,477.05 – ₹1525 |
| Cipla | ₹1,553.94 (-1.34%) | ₹1,528.8 – ₹1589 |
| Eicher Motors | ₹4,962.25 (-1.01%) | ₹4,931.14 – ₹5,047.95 |
| Kotak Mahindra Bank | ₹1,796.94 (-0.94%) | ₹1,783.55 – ₹1,826.75 |
| Axis Bank | ₹1,170.05 (-0.62%) | ₹1,163.65 – ₹1,194.58 |
Nifty 50 Stocks To Watch for Tomorrow
Bharat Petroleum: A Closer Look at Recent Performance
- Performance Overview: Over the last 25 trading days, Bharat Petroleum closed higher 16 times and lower 9 times. This suggests positive momentum in recent weeks.
- Recent Trend: It’s been a strong run for Bharat Petroleum! The stock has enjoyed a 4-day winning streak, closing higher every day since Tuesday, July 23, 2024.
- Returns: If you had invested ₹10,000 in Bharat Petroleum 25 trading days ago, your investment would be worth ₹10,910 today – a 9.1% return. That’s a solid performance!
- Financial Insight: Bharat Petroleum is a financially strong company. Over the past year (ending July 29, 2024), they generated ₹4,50,427.87 Crore in revenue and earned ₹19,056.08 Crore in profit.
- As of Monday, July 29, 2024, Bharat Petroleum has a market capitalization of ₹1,42,650.19 Crore, indicating its significant size and value in the market.
- Summary: Bharat Petroleum is showing bullish signs, with strong recent performance and a solid financial foundation. Investors interested in this stock should keep an eye on its price movements for both short-term and long-term growth opportunities. Check out our Bharat Petroleum Target for Tomorrow and Bharat Petroleum Targets for 2024 & 2025 for insights on potential price direction.
Bharat Petroleum Financial Performance
| Metric | Value | Description |
|---|---|---|
| Market Capital | 1,42,650.19 Crore | Market valuation of Bharat Petroleum’s shares. |
| Revenue (TTM) | 4,50,427.87 Crore | Total revenue generated by Bharat Petroleum over the past twelve months. |
| Net Income (TTM) | +19,056.08 Crore | Net Profit or Loss after all the expenses over the past twelve months. |
| Operating Margin | 3.48% | Income from operations as a percentage of revenue, before taxes and interest. |
| Profit Margin | 4.23% | Net income as a percentage of revenue, after all expenses. |
| Revenue Growth (Quarterly) | +0.1% | Change in revenue compared to the previous quarter. |
| Earnings Growth (YOY Quarterly) | -73.3% | Change in earnings compared to the same quarter last year. |
| Debt-to-Equity (D/E) Ratio | 72.18 | Company’s total debt divided by total shareholder equity. |
| Total Debt | 54,599.05 Crore | Sum of Bharat Petroleum’s current & long-term financial obligations. |
| Total Cash | 10,577.03 Crore | Total amount of liquid funds available to Bharat Petroleum. |
| Beta | 1.07 | Beta is greater than 1 indicating that the Bharat Petroleum’s price is more volatile than the market. |
➲ Axis Bank (Bearish Pattern)
- Performance Overview: Over the past 25 trading days, Axis Bank’s share price has closed lower 12 times and higher 13 times.
- Recent Trend: Axis Bank has been on a one-day losing streak, not closing higher since Friday, July 26, 2024.
- Returns: In the last 25 trading sessions, Axis Bank has returned -4.96%. This means an investment of ₹10,000 would be worth ₹9,504 today.
- Financial Insight: Over the past 12 months, Axis Bank generated revenue of ₹64,970.45 Crore and earned a profit of ₹26,731.28 Crore.
- As of Monday, July 29, 2024, Axis Bank has a Market Capital of ₹3,63,920.07 Crore.
- Summary: Axis Bank is currently in a bearish phase. Keep a close eye on its performance. You can find potential price targets for the next day, as well as projections for 2024 and 2025, here and here, respectively.
Axis Bank Financial Performance
| Metric | Value | Description |
|---|---|---|
| Market Capital | 3,63,920.07 Crore | Market valuation of Axis Bank’s shares. |
| Revenue (TTM) | 64,970.45 Crore | Total revenue generated by Axis Bank over the past twelve months. |
| Net Income (TTM) | +26,731.28 Crore | Net Profit or Loss after all the expenses over the past twelve months. |
| Operating Margin | 46.89% | Income from operations as a percentage of revenue, before taxes and interest. |
| Profit Margin | 41.14% | Net income as a percentage of revenue, after all expenses. |
| Revenue Growth (Quarterly) | +9.3% | Change in revenue compared to the previous quarter. |
| Earnings Growth (YOY Quarterly) | +5.7% | Change in earnings compared to the same quarter last year. |
| Debt-to-Equity (D/E) Ratio | 1.35 | Company’s total debt divided by total shareholder equity. |
| Total Debt | 2,24,036.7 Crore | Sum of Axis Bank’s current & long-term financial obligations. |
| Total Cash | 63,290.44 Crore | Total amount of liquid funds available to Axis Bank. |
| Beta | 0.94 | Beta is less than 1 indicating that the Axis Bank’s price is less volatile than the market. |
Nifty 500 Performance Overview
The Nifty 500 kicked off the day at ₹23,423.15, showing some energetic movement throughout the session. It touched a low of ₹23,326.05 and reached a high of ₹23,496.4 before closing at ₹23,394.19, a +0.43% gain for the day.
The day’s action was influenced by some strong performers and laggards, giving us a glimpse into the market’s direction.
Nifty 500 Top Gainers
| Stock | Close | Range |
|---|---|---|
| Bandhan Bank | ₹218.87 (13.69%) | ₹200.11 – ₹220 |
| E.I.D. Parry | ₹845.5 (8.36%) | ₹789.29 – ₹859.95 |
| Kaynes Technology | ₹4594 (8.09%) | ₹4,353.04 – ₹4725 |
| 360 ONE WAM | ₹1,068.15 (7.16%) | ₹1,008.04 – ₹1079 |
| Deepak Fertilisers | ₹919.25 (6.61%) | ₹865.34 – ₹932.5 |
Nifty 500 Top Losers
| Stock | Close | Range |
|---|---|---|
| Equitas Small Finance Bank | ₹82.44 (-5.2%) | ₹82.29 – ₹85.9 |
| Brightcom Group | ₹7.23 (-5.12%) | ₹7.23 – ₹7.23 |
| Aarti Drugs | ₹503.25 (-4.46%) | ₹500 – ₹520 |
| CSB Bank | ₹344.54 (-3.82%) | ₹338.75 – ₹368.14 |
| Blue Dart | ₹7,688.89 (-2.61%) | ₹7,652.14 – ₹8 |
Nifty 51 to 500 Stocks To Watch for Tomorrow
Ajanta Pharma (Bullish Pattern)
- Performance Overview: In the last 25 trading sessions, Ajanta Pharma has closed higher 15 times and lower 10 times.
- Recent Trend: Ajanta Pharma has been on a strong run, closing higher for 8 consecutive days, starting on Tuesday, July 16th, 2024.
- Returns: Ajanta Pharma delivered a 3.35% return over the past 25 trading days. This means that an investment of ₹10,000 would have grown to ₹10,335.
- Financial Insight: Over the past year, Ajanta Pharma has generated a revenue of ₹4,208.71 Crore and achieved a profit of ₹816.16 Crore.
- As of Monday, July 29th, 2024, Ajanta Pharma has a Market Capital of ₹29,993.72 Crore.
- Summary: Ajanta Pharma presents a strong bullish pattern. It’s worth keeping a close eye on its price movements for both short-term and long-term opportunities. Check out Ajanta Pharma Target for Tomorrow and Ajanta Pharma Targets for 2024 & 2025.
Ajanta Pharma Financial Performance
| Metric | Value | Description |
|---|---|---|
| Market Capital | 29,993.72 Crore | Market valuation of Ajanta Pharma’s shares. |
| Revenue (TTM) | 4,208.71 Crore | Total revenue generated by Ajanta Pharma over the past twelve months. |
| Net Income (TTM) | +816.16 Crore | Net Profit or Loss after all the expenses over the past twelve months. |
| Operating Margin | 24.01% | Income from operations as a percentage of revenue, before taxes and interest. |
| Profit Margin | 19.39% | Net income as a percentage of revenue, after all expenses. |
| Revenue Growth (Quarterly) | +19.5% | Change in revenue compared to the previous quarter. |
| Earnings Growth (YOY Quarterly) | +65.8% | Change in earnings compared to the same quarter last year. |
| Debt-to-Equity (D/E) Ratio | 1.03 | Company’s total debt divided by total shareholder equity. |
| Total Debt | 36.84 Crore | Sum of Ajanta Pharma’s current & long-term financial obligations. |
| Total Cash | 459.54 Crore | Total amount of liquid funds available to Ajanta Pharma. |
| Beta | 0.04 | Beta is less than 1 indicating that the Ajanta Pharma’s price is less volatile than the market. |
➲ eClerx (Bearish Pattern)
- Performance Overview: In the last 25 trading sessions, eClerx has closed lower than the previous day 14 times and higher 11 times. This suggests a slightly bearish trend in recent trading activity.
- Recent Trend: eClerx has experienced a three-day decline, with no gains since Wednesday, July 24, 2024.
- Returns: Over the past 25 trading days, eClerx has generated a -1.69% return. This means that an investment of ₹10,000 would have decreased to ₹9,831 during this period.
- Financial Insight: Over the past 12 months, eClerx has generated a revenue of ₹2,925.54 Crore and earned a profit of ₹511.45 Crore.
- As of Monday, July 29, 2024, eClerx has a Market Capital of ₹11,223.42 Crore.
- Summary: eClerx is currently facing some downward pressure. We recommend investors stay informed and carefully consider their investment strategy. You can explore potential future price movements by visiting eClerx Target for Tomorrow and eClerx Targets for 2024 & 2025.
eClerx Financial Performance
| Metric | Value | Description |
|---|---|---|
| Market Capital | 11,223.42 Crore | Market valuation of eClerx’s shares. |
| Revenue (TTM) | 2,925.54 Crore | Total revenue generated by eClerx over the past twelve months. |
| Net Income (TTM) | +511.45 Crore | Net Profit or Loss after all the expenses over the past twelve months. |
| Operating Margin | 21.13% | Income from operations as a percentage of revenue, before taxes and interest. |
| Profit Margin | 17.48% | Net income as a percentage of revenue, after all expenses. |
| Revenue Growth (Quarterly) | +10.6% | Change in revenue compared to the previous quarter. |
| Earnings Growth (YOY Quarterly) | -1.5% | Change in earnings compared to the same quarter last year. |
| Debt-to-Equity (D/E) Ratio | 11.81 | Company’s total debt divided by total shareholder equity. |
| Total Debt | 265.74 Crore | Sum of eClerx’s current & long-term financial obligations. |
| Total Cash | 1,084.51 Crore | Total amount of liquid funds available to eClerx. |
| Beta | 1.08 | Beta is greater than 1 indicating that the eClerx’s price is more volatile than the market. |
Top Stocks That Created a New All Time High Today
Top Large Cap Stocks That Created a New All Time High Today
Companies with Market Capital more than 20,000 Crores| Stock | Close | New All-Time High (ATH) | Previous ATH | Previous ATH Date |
|---|---|---|---|---|
| Alembic Pharma | 1239.05 (+1.86%) | 1255.00 (+%) | Thu 01 Jan 1970 | |
| Apollo Tyres | 551.75 (+0.24%) | 564.59 (+%) | Thu 01 Jan 1970 | |
| Ashok Leyland | 256.35 (+4.04%) | 258.85 (+%) | Thu 01 Jan 1970 | |
| Aurobindo Pharma | 1405.00 (+1.35%) | 1417.00 (+%) | Thu 01 Jan 1970 | |
| Bayer Cropscience | 6945.50 (+4.87%) | 7061.25 (+%) | Thu 01 Jan 1970 |
Top Mid Cap Stocks That Created a New All Time High Today
Companies with Market Capital between 5,000 Crores to 20,000 Crores| Stock | Close | New All-Time High (ATH) | Previous ATH | Previous ATH Date |
|---|---|---|---|---|
| ASK Automotive | 416.95 (+4.21%) | 433.79 (+%) | Thu 01 Jan 1970 | |
| Aditya Vision | 4815.14 (-2.35%) | 5049.95 (+%) | Thu 01 Jan 1970 | |
| Banco Products | 760.04 (-0.04%) | 799.15 (+%) | Thu 01 Jan 1970 | |
| Black Box | 473.04 (+4.99%) | 473.04 (+%) | Thu 01 Jan 1970 | |
| CMS Info Systems | 587.25 (+5.71%) | 591.59 (+%) | Thu 01 Jan 1970 |
Top Small Cap Stocks That Created a New All Time High Today
Companies with Market Capital less than 5,000 Crores| Stock | Close | New All-Time High (ATH) | Previous ATH | Previous ATH Date |
|---|---|---|---|---|
| 20 Microns | 277.89 (+7.89%) | 294.79 (+%) | Thu 01 Jan 1970 | |
| Ace Software Exports | 340.64 (-2%) | 350.00 (+132.89%) | 150.28 | Mon 01 Apr 2024 |
| Abans Holdings | 560.54 (+0.31%) | 576.50 (+32.34%) | 435.60 | Wed 10 Apr 2024 |
| Ahmedabad Steelcraft | 152.85 (+1.96%) | 152.85 (+%) | Thu 01 Jan 1970 | |
| Associated Alcohols | 826.70 (+3.4%) | 864.00 (+%) | Thu 01 Jan 1970 |