Home / Mon 10 Jun 2024 Market Recap
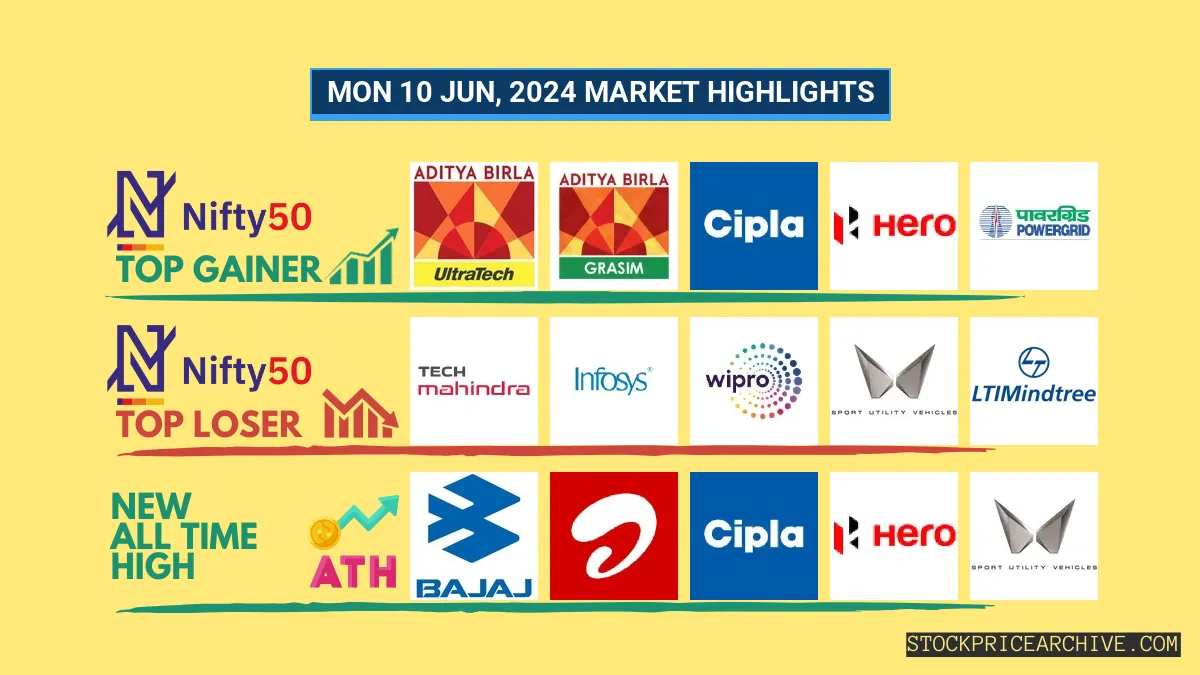
10 Jun 2024: Nifty 50 Closes at ₹23,234.75 (-0.24%), Apollo Hospitals & Tata Consumer Products Show Contrasting Trends
Show Table of Contents
Table of Contents
- 1: Top Indices Performance Overview
- 2: Nifty 50 Performance Overview
- 2.1: Nifty 50 Top Gainers
- 2.2: Nifty 50 Top Losers
- 2.3: Nifty 50 Stocks To Watch for Tomorrow
- 2.3.1: ➲ Apollo Hospitals (Bullish Pattern)
- 2.3.2: ➲ Tata Consumer Products (Bearish Pattern)
- 3: Nifty 500 Performance Overview
- 3.1: Nifty 500 Top Gainers
- 3.2: Nifty 500 Top Losers
- 3.3: Nifty 51 to 500 Stocks To Watch for Tomorrow
- 3.3.1: ➲ Procter & Gamble (Bullish Pattern)
- 3.3.2: ➲ Concord Biotech (Bearish Pattern)
- 4: Top Stocks That Created a New All Time High Today
- 4.1: Top Large Cap Stocks That Created a New All Time High Today
- 4.2: Top Mid Cap Stocks That Created a New All Time High Today
- 4.3: Top Small Cap Stocks That Created a New All Time High Today
Top Indices Performance Overview
| Stock | Close | Range |
|---|---|---|
| NIFTY 50 | ₹23,234.75 (-0.24%) | ₹23,228.94 – ₹23,409.5 |
| NIFTY BANK | ₹49,687.64 (-0.24%) | ₹49,628.39 – ₹50,250.5 |
| NIFTY FIN SERVICE | ₹22,105.9 (-0.28%) | ₹22,087.09 – ₹22,326.09 |
| NIFTY IT | ₹34,494.8 (-1.92%) | ₹34,362.6 – ₹35,165.25 |
| NIFTY AUTO | ₹25,017.5 (-0.02%) | ₹24,913.8 – ₹25,258.69 |
| NIFTY ENERGY | ₹40,480.3 (0.48%) | ₹40,390.1 – ₹41,017.85 |
Nifty 50 Performance Overview
Nifty 50 Market Update
Today, the Nifty 50 commenced trading at ₹23,317.09. Throughout the session, it fluctuated between a low of ₹23,228.94 and a high of ₹23,409.5. The index eventually closed at ₹23,234.75, marking a decline of -0.24%.
Refer to the provided table for insights into the top gainers and losers that influenced today’s Nifty 50 movement.
Nifty 50 Top Gainers
| Stock | Close | Range |
|---|---|---|
| UltraTech Cement | ₹10804 (3.25%) | ₹10,463.15 – ₹10,907.7 |
| GRASIM | ₹2443 (2.65%) | ₹2,378.14 – ₹2472 |
| Cipla | ₹1,532.55 (2.35%) | ₹1,502.25 – ₹1,540.65 |
| Hero MotoCorp | ₹5710 (2.29%) | ₹5,598.1 – ₹5785 |
| Power Grid | ₹315.79 (2.08%) | ₹313 – ₹323.35 |
Nifty 50 Top Losers
| Stock | Close | Range |
|---|---|---|
| Tech Mahindra | ₹1,341.34 (-2.64%) | ₹1,335.5 – ₹1373 |
| Infosys | ₹1,498.09 (-2.32%) | ₹1,497.34 – ₹1,527.19 |
| WIPRO | ₹475.5 (-1.87%) | ₹473.64 – ₹488.39 |
| Mahindra & Mahindra | ₹2,812.8 (-1.57%) | ₹2,801.64 – ₹2,884.94 |
| LTIMindtree | ₹4,899.95 (-1.56%) | ₹4865 – ₹4,978.79 |
Nifty 50 Stocks To Watch for Tomorrow
➲ Apollo Hospitals (Bullish Pattern)
- Performance Review: Apollo Hospitals has been performing steadily in recent trading sessions, gaining ground on 14 out of the last 26 trading days and experiencing a slight pullback on the remaining 12.
- Current Trend: The stock is exhibiting positive momentum, having closed in the green for 4 consecutive days since Tuesday, June 4th, 2024.
- Returns: Over the past 26 trading sessions, Apollo Hospitals has generated a modest return of 0.43%, translating to a potential gain of ₹43 for every ₹10,000 invested.
- Financial Performance: In the past 12 months, Apollo Hospitals has demonstrated strong financial performance, generating a revenue of ₹19,059.19 Crore and a profit of ₹898.6 Crore.
- As of Monday, June 10th, 2024, Apollo Hospitals’ Market Capitalization stands at an impressive ₹86,303.34 Crore.
- Outlook: Apollo Hospitals presents a compelling investment opportunity with its bullish trend. Investors are encouraged to monitor its price movements and consider potential investment strategies:
- Short-Term Target: Interested in the immediate direction of Apollo Hospitals? Check out our Apollo Hospitals Target for Tomorrow.
- Long-Term Targets: Looking ahead, our analysis provides Apollo Hospitals Targets for 2024 & 2025.
Apollo Hospitals Financial Performance
| Metric | Value | Description |
|---|---|---|
| Market Capital | 86,303.34 Crore | Market valuation of Apollo Hospitals’s shares. |
| Revenue (TTM) | 19,059.19 Crore | Total revenue generated by Apollo Hospitals over the past twelve months. |
| Net Income (TTM) | +898.6 Crore | Net Profit or Loss after all the expenses over the past twelve months. |
| Operating Margin | 9.11% | Income from operations as a percentage of revenue, before taxes and interest. |
| Profit Margin | 4.71% | Net income as a percentage of revenue, after all expenses. |
| Revenue Growth (Quarterly) | +14.89% | Change in revenue compared to the previous quarter. |
| Earnings Growth (YOY Quarterly) | +75.59% | Change in earnings compared to the same quarter last year. |
| Debt-to-Equity (D/E) Ratio | 72.84 | Company’s total debt divided by total shareholder equity. |
| Total Debt | 5,332.6 Crore | Sum of Apollo Hospitals’s current & long-term financial obligations. |
| Total Cash | 1,617.79 Crore | Total amount of liquid funds available to Apollo Hospitals. |
| Beta | 0.56 | Beta is less than 1 indicating that the Apollo Hospitals’s price is less volatile than the market. |
➲ Tata Consumer Products (Bearish Pattern)
- Performance Overview: Recently, Tata Consumer Products has been in a downturn, ending in the red 14 times and rising 12 times out of the past 26 trading sessions.
- Recent Trend: Tata Consumer Products has been on a 3-day red streak, without a single day closing in green since Wed 05 Jun 2024.
- Returns: Your investment in Tata Consumer Products would have grown by 2.33% over the last 26 trading sessions. For instance, an investment of ₹10,000 would now be worth ₹10,233.
- Financial Insight: Analyzing the past 12 months, Apollo Hospitals has achieved a total revenue of ₹15,205.84 Crore, resulting in a profit of ₹1,150.32 Crore.
- As of Mon 10 Jun 2024, Apollo Hospitals has a substantial Market Capital of ₹1,06,484.01 Crore.
- Summary: Tata Consumer Products is facing a bearish trend. Investors should exercise caution and closely monitor the stock’s performance, particularly its Tomorrow’s Target and Targets for 2024 & 2025.
Tata Consumer Products Financial Performance
| Metric | Value | Description |
|---|---|---|
| Market Capital | 1,06,484.01 Crore | Market valuation of Tata Consumer Products’s shares. |
| Revenue (TTM) | 15,205.84 Crore | Total revenue generated by Tata Consumer Products over the past twelve months. |
| Net Income (TTM) | +1,150.32 Crore | Net Profit or Loss after all the expenses over the past twelve months. |
| Operating Margin | 12.85% | Income from operations as a percentage of revenue, before taxes and interest. |
| Profit Margin | 7.56% | Net income as a percentage of revenue, after all expenses. |
| Revenue Growth (Quarterly) | +8.5% | Change in revenue compared to the previous quarter. |
| Earnings Growth (YOY Quarterly) | -19.3% | Change in earnings compared to the same quarter last year. |
| Debt-to-Equity (D/E) Ratio | 19.94 | Company’s total debt divided by total shareholder equity. |
| Total Debt | 3,477.22 Crore | Sum of Tata Consumer Products’s current & long-term financial obligations. |
| Total Cash | 2,702.98 Crore | Total amount of liquid funds available to Tata Consumer Products. |
| Beta | 0.49 | Beta is less than 1 indicating that the Tata Consumer Products’s price is less volatile than the market. |
Nifty 500 Performance Overview
The Nifty 500 opened the session at ₹21,843.5 and experienced fluctuations throughout the day. It reached a low of ₹21,758.69 and a high of ₹21,929.94 before settling at ₹21,785.3, a marginal increase of 0.09%.Nifty 500 Top Gainers
| Stock | Close | Range |
|---|---|---|
| Fertilisers & Chemicals Travancore | ₹804.9 (14.97%) | ₹700.75 – ₹810 |
| Rallis India | ₹313 (11.03%) | ₹285 – ₹321 |
| Chemplast Sanmar | ₹541.34 (10.2%) | ₹480.04 – ₹561.79 |
| RCF | ₹168.7 (9.23%) | ₹154.75 – ₹168.95 |
| NIACL | ₹238.5 (7.91%) | ₹222.11 – ₹249.89 |
Nifty 500 Top Losers
| Stock | Close | Range |
|---|---|---|
| Motilal Oswal Financial Services | ₹667.75 (-72.49%) | ₹639.7 – ₹720.95 |
| IRB Infrastructure Developers | ₹70.25 (-8.58%) | ₹69.87 – ₹75.9 |
| Poonawalla Fincorp | ₹427.5 (-8.17%) | ₹423.45 – ₹470.39 |
| Suzlon Energy | ₹47.4 (-5.02%) | ₹47.4 – ₹48.59 |
| Vedanta | ₹442.29 (-3.99%) | ₹441.45 – ₹455.5 |
Nifty 51 to 500 Stocks To Watch for Tomorrow
➲ Procter & Gamble (Bullish Pattern)
- Performance Overview: In the last 26 trading sessions, Procter & Gamble has closed in the green 13 times and in the red 13 times.
- Recent Trend: Procter & Gamble has been on a 7-day green streak, without a single day closing in the red since Thursday, May 30, 2024.
- Returns: Procter & Gamble gave a 6.12% return in the last 26 trading sessions, meaning your investment of ₹10,000 would have become ₹10,612.
- Financial Insight: Over the past 12 months, Procter & Gamble has generated a revenue of ₹4,126.47 Crore and created a profit of ₹745.2 Crore.
- As of Monday, June 10, 2024, Procter & Gamble has a Market Capital of ₹51,354.94 Crore.
- Summary: Procter & Gamble exhibits a robust bullish pattern. Investors should monitor its price movements for both short-term and long-term growth prospects: Checkout Procter & Gamble Target for Tomorrow and Procter & Gamble Targets for 2024 & 2025.
Procter & Gamble Financial Performance
| Metric | Value | Description |
|---|---|---|
| Market Capital | 51,354.94 Crore | Market valuation of Procter & Gamble’s shares. |
| Revenue (TTM) | 4,126.47 Crore | Total revenue generated by Procter & Gamble over the past twelve months. |
| Net Income (TTM) | +745.2 Crore | Net Profit or Loss after all the expenses over the past twelve months. |
| Operating Margin | 24.22% | Income from operations as a percentage of revenue, before taxes and interest. |
| Profit Margin | 18.05% | Net income as a percentage of revenue, after all expenses. |
| Revenue Growth (Quarterly) | +13.5% | Change in revenue compared to the previous quarter. |
| Earnings Growth (YOY Quarterly) | -6.5% | Change in earnings compared to the same quarter last year. |
| Debt-to-Equity (D/E) Ratio | 0.34 | Company’s total debt divided by total shareholder equity. |
| Total Debt | 3.58 Crore | Sum of Procter & Gamble’s current & long-term financial obligations. |
| Total Cash | 702.42 Crore | Total amount of liquid funds available to Procter & Gamble. |
| Beta | 0.18 | Beta is less than 1 indicating that the Procter & Gamble’s price is less volatile than the market. |
➲ Concord Biotech (Bearish Pattern)
- Performance Overview: In the last 26 trading sessions, Concord Biotech has closed in red 19 times and in green 7 times.
- Recent Trend: Concord Biotech has been on a 3-day red streak, without a single day closing in green since Wednesday, June 5th, 2024.
- Returns: Concord Biotech gave a -11.39% returns in the last 26 trading sessions, meaning your investment of ₹10,000 would have become ₹8,861
- Financial Insight: Over the past 12 months, Procter & Gamble has generated a revenue of ₹1,016.93 Crore and created a profit of ₹308.1 Crore.
- As of Monday, June 10th, 2024, Procter & Gamble has a Market Capital of ₹15,227.38 Crore.
- Summary: Concord Biotech is currently experiencing a bearish phase. We advise investors to keep a close watch, especially on Concord Biotech Target for Tomorrow and Concord Biotech Targets for 2024 & 2025.
Concord Biotech Financial Performance
| Metric | Value | Description |
|---|---|---|
| Market Capital | 15,227.38 Crore | Market valuation of Concord Biotech’s shares. |
| Revenue (TTM) | 1,016.93 Crore | Total revenue generated by Concord Biotech over the past twelve months. |
| Net Income (TTM) | +308.1 Crore | Net Profit or Loss after all the expenses over the past twelve months. |
| Operating Margin | 37.79% | Income from operations as a percentage of revenue, before taxes and interest. |
| Profit Margin | 30.29% | Net income as a percentage of revenue, after all expenses. |
| Revenue Growth (Quarterly) | +17% | Change in revenue compared to the previous quarter. |
| Earnings Growth (YOY Quarterly) | +3.9% | Change in earnings compared to the same quarter last year. |
| Debt-to-Equity (D/E) Ratio | 0.63 | Company’s total debt divided by total shareholder equity. |
| Total Debt | 9.73 Crore | Sum of Concord Biotech’s current & long-term financial obligations. |
| Total Cash | 290.72 Crore | Total amount of liquid funds available to Concord Biotech. |
Top Stocks That Created a New All Time High Today
Top Large Cap Stocks That Created a New All Time High Today
Companies with Market Capital more than 20,000 Crores| Stock | Close | New All-Time High (ATH) | Previous ATH | Previous ATH Date |
|---|---|---|---|---|
| ARE&M | 1405.69 (+0.32%) | 1538.59 (+28.21%) | 1200.00 | Mon 01 Apr 2024 |
| Bajaj Auto | 9725.00 (-0.01%) | 9921.54 (+%) | Thu 01 Jan 1970 | |
| Balkrishna Industries | 3240.00 (+1.18%) | 3267.75 (+%) | Thu 01 Jan 1970 | |
| Bharti Airtel | 1425.59 (+0.02%) | 1436.44 (+6.32%) | 1351.00 | Tue 23 Apr 2024 |
| Bharti Hexacom | 1091.25 (+1.87%) | 1118.65 (+%) | Thu 01 Jan 1970 |
Top Mid Cap Stocks That Created a New All Time High Today
Companies with Market Capital between 5,000 Crores to 20,000 Crores| Stock | Close | New All-Time High (ATH) | Previous ATH | Previous ATH Date |
|---|---|---|---|---|
| Amara Raja Batteries | 1397.40 (-0.27%) | 1532.09 (+35.82%) | 1128.00 | Tue 25 Aug 2015 |
| Ashoka Buildcon | 219.31 (+5.64%) | 229.94 (+%) | Thu 01 Jan 1970 | |
| Azad Engineering | 1615.94 (+5%) | 1615.94 (+%) | Thu 01 Jan 1970 | |
| Bikaji Foods | 674.65 (-2.37%) | 711.79 (+%) | Thu 01 Jan 1970 | |
| CMS Info Systems | 472.20 (+1.54%) | 478.50 (+%) | Thu 01 Jan 1970 |
Top Small Cap Stocks That Created a New All Time High Today
Companies with Market Capital less than 5,000 Crores| Stock | Close | New All-Time High (ATH) | Previous ATH | Previous ATH Date |
|---|---|---|---|---|
| Ace Software Exports | 235.35 (+1.99%) | 235.35 (+56.6%) | 150.28 | Mon 01 Apr 2024 |
| Advait Infratech | 1817.65 (+4.99%) | 1817.65 (+9.32%) | 1662.60 | Mon 01 Apr 2024 |
| Ahmedabad Steelcraft | 79.87 (+1.99%) | 79.87 (+%) | Thu 01 Jan 1970 | |
| A. K. Capital Services | 1085.05 (+3.82%) | 1180.00 (+%) | Thu 01 Jan 1970 | |
| A.K. Spintex | 173.50 (+2.17%) | 181.89 (+%) | Thu 01 Jan 1970 |