Home / Thu 25 Jul 2024 Market Recap
25 Jul 2024: Nifty Closes at ₹24,416.59 (+0.01%), HDFC Life on 4-day Green Streak & Adani Energy on 5-day Green Streak
Show Table of Contents
Table of Contents
- 1: Top Indices Performance Overview
- 2: Nifty 50 Performance Overview
- 2.1: Nifty 50 Top Gainers
- 2.2: Nifty 50 Top Losers
- 2.3: Nifty 50 Stocks To Watch for Tomorrow
- 2.3.1: HDFC Life (Bullish Pattern)
- 2.3.2: ➲ Axis Bank (Showing Bearish Signs)
- 3: Nifty 500 Performance Overview
- 3.1: Nifty 500 Top Gainers
- 3.2: Nifty 500 Top Losers
- 3.3: Nifty 51 to 500 Stocks To Watch for Tomorrow
- 3.3.1: Adani Energy (Bullish Pattern)
- 3.3.2: ➲ Indian Railway Finance Corporation (Bearish Trend)
- 4: Top Stocks That Created a New All Time High Today
- 4.1: Top Large Cap Stocks That Created a New All Time High Today
- 4.2: Top Mid Cap Stocks That Created a New All Time High Today
- 4.3: Top Small Cap Stocks That Created a New All Time High Today
Top Indices Performance Overview
| Stock | Close | Range |
|---|---|---|
| NIFTY 50 | ₹24,416.59 (0.01%) | ₹24,210.8 – ₹24,426.15 |
| NIFTY BANK | ₹50,886.55 (-0.84%) | ₹50,560.35 – ₹50,989.44 |
| NIFTY FIN SERVICE | ₹23,052.59 (-0.49%) | ₹22,866.44 – ₹23,063.15 |
| NIFTY AUTO | ₹25,627.34 (1.25%) | ₹25,147.34 – ₹25,640.4 |
Nifty 50 Performance Overview
The Nifty 50 started the day at ₹24,235.05. It went through some ups and downs, reaching a low of ₹24,210.80 and a high of ₹24,426.15. When the market closed, the Nifty 50 finished at ₹24,416.59 (+0.01%), a slight gain for the day.
Let’s take a look at the top gainers and losers that influenced the Nifty 50’s performance today.
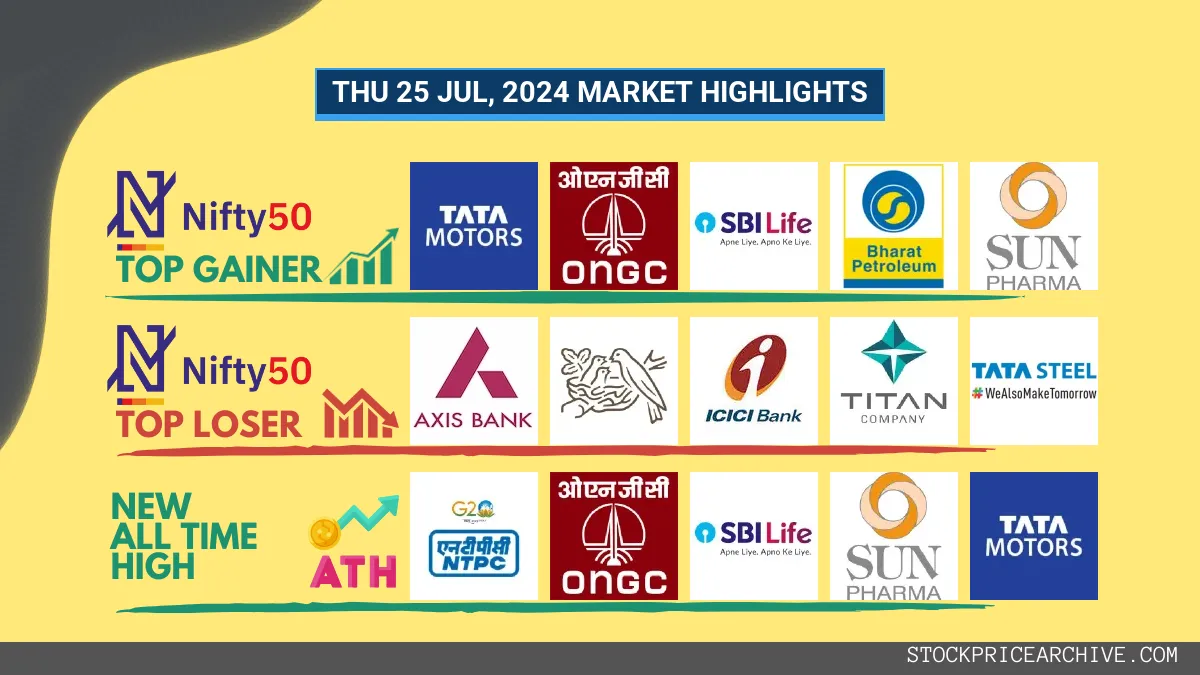
Nifty 50 Top Gainers
| Stock | Close | Range |
|---|---|---|
| Tata Motors | ₹1,089.5 (6.01%) | ₹1,024.33 – ₹1094 |
| ONGC | ₹334.7 (4.74%) | ₹316.5 – ₹337.45 |
| SBI Life Insurance | ₹1,695.4 (3.82%) | ₹1645 – ₹1,701.34 |
| Bharat Petroleum | ₹326.54 (3.67%) | ₹311 – ₹327 |
| Sun Pharma | ₹1,665.8 (2.86%) | ₹1,602.19 – ₹1681 |
Nifty 50 Top Losers
| Stock | Close | Range |
|---|---|---|
| Axis Bank | ₹1,175.9 (-5.12%) | ₹1,155.5 – ₹1200 |
| Nestle India | ₹2,480.64 (-2.4%) | ₹2,459.44 – ₹2,556.64 |
| ICICI BANK | ₹1,196.83 (-2.14%) | ₹1,190.69 – ₹1,217.5 |
| TITAN | ₹3,405.8 (-2.09%) | ₹3,384.44 – ₹3,454.39 |
| Tata Steel | ₹157.5 (-1.76%) | ₹156.88 – ₹158.5 |
Nifty 50 Stocks To Watch for Tomorrow
HDFC Life (Bullish Pattern)
- Performance Overview: In the last 26 trading sessions, HDFC Life has closed higher than the previous day 19 times and lower 7 times.
- Recent Trend: HDFC Life has been on a 4-day winning streak, without a single day closing in the red since Friday, July 19, 2024.
- Returns: HDFC Life provided a 13.26% return over the last 26 trading sessions. This means an investment of ₹10,000 would have grown to ₹11,326.
- Financial Insight: Over the past 12 months, HDFC Life has generated a revenue of ₹1,05,462.41 Crore and recorded a profit of ₹1,636.34 Crore.
- As of Thursday, July 25, 2024, HDFC Life has a Market Capital of ₹1,36,746.48 Crore.
- Summary: HDFC Life is showing strong signs of a bullish trend. Investors should keep a close eye on its price movements to identify potential opportunities for both short-term and long-term growth: Check out HDFC Life Target for Tomorrow and HDFC Life Targets for 2024 & 2025.
HDFC Life Financial Performance
| Metric | Value | Description |
|---|---|---|
| Market Capital | 1,36,746.48 Crore | Market valuation of HDFC Life’s shares. |
| Revenue (TTM) | 1,05,462.41 Crore | Total revenue generated by HDFC Life over the past twelve months. |
| Net Income (TTM) | +1,636.34 Crore | Net Profit or Loss after all the expenses over the past twelve months. |
| Operating Margin | 1.48% | Income from operations as a percentage of revenue, before taxes and interest. |
| Profit Margin | 1.55% | Net income as a percentage of revenue, after all expenses. |
| Revenue Growth (Quarterly) | +15% | Change in revenue compared to the previous quarter. |
| Earnings Growth (YOY Quarterly) | +15.3% | Change in earnings compared to the same quarter last year. |
| Debt-to-Equity (D/E) Ratio | 6.18 | Company’s total debt divided by total shareholder equity. |
| Total Debt | 950 Crore | Sum of HDFC Life’s current & long-term financial obligations. |
| Total Cash | 579.77 Crore | Total amount of liquid funds available to HDFC Life. |
| Beta | 0.83 | Beta is less than 1 indicating that the HDFC Life’s price is less volatile than the market. |
➲ Axis Bank (Showing Bearish Signs)
- Performance Overview: Over the past 26 trading days, Axis Bank’s share price has closed lower than the previous day 12 times, and higher 14 times.
- Recent Trend: Axis Bank has had a bit of a rough patch, closing lower for the past five trading days, since Thursday, July 18, 2024.
- Returns: In the last 26 trading days, Axis Bank’s returns have been -1.44%. This means that if you had invested ₹10,000 in Axis Bank during this period, your investment would be worth ₹9,856 today.
- Financial Insight: Over the past 12 months, Axis Bank has generated a revenue of ₹63,399.29 Crore and a profit of ₹26,386.19 Crore.
- As of Thursday, July 25, 2024, Axis Bank has a Market Capital of ₹3,99,460.19 Crore.
- Summary: Axis Bank’s recent performance has been a bit bearish. It’s a good idea to keep a close eye on its upcoming movements. We recommend checking out the Axis Bank Target for Tomorrow and Axis Bank Targets for 2024 & 2025 for further insights.
Axis Bank Financial Performance
| Metric | Value | Description |
|---|---|---|
| Market Capital | 3,99,460.19 Crore | Market valuation of Axis Bank’s shares. |
| Revenue (TTM) | 63,399.29 Crore | Total revenue generated by Axis Bank over the past twelve months. |
| Net Income (TTM) | +26,386.19 Crore | Net Profit or Loss after all the expenses over the past twelve months. |
| Operating Margin | 8.86% | Income from operations as a percentage of revenue, before taxes and interest. |
| Profit Margin | 41.61% | Net income as a percentage of revenue, after all expenses. |
| Revenue Growth (Quarterly) | +27% | Change in revenue compared to the previous quarter. |
| Earnings Growth (YOY Quarterly) | +20.31% | Change in earnings compared to the same quarter last year. |
| Debt-to-Equity (D/E) Ratio | 1.44 | Company’s total debt divided by total shareholder equity. |
| Total Debt | 2,28,199.55 Crore | Sum of Axis Bank’s current & long-term financial obligations. |
| Total Cash | 61,607.6 Crore | Total amount of liquid funds available to Axis Bank. |
| Beta | 0.94 | Beta is less than 1 indicating that the Axis Bank’s price is less volatile than the market. |
Nifty 500 Performance Overview
The Nifty 500 kicked off the day at ₹22,855.84. Throughout the trading session, it experienced some ups and downs, hitting a low of ₹22,820.3 and reaching a high of ₹22,964.94 before finally settling at a close of ₹22,941.05 (+0.33%).
The top gainers and losers played a role in shaping the Nifty 500’s movement today.
Nifty 500 Top Gainers
| Stock | Close | Range |
|---|---|---|
| MMTC | ₹123.12 (20%) | ₹105.45 – ₹123.12 |
| Data Patterns | ₹3410 (10.46%) | ₹3,047.85 – ₹3433 |
| Jyothy Labs | ₹548 (7.81%) | ₹503.39 – ₹573.75 |
| Syngene International | ₹794 (6.46%) | ₹736.59 – ₹798.29 |
| Tata Motors DVR | ₹745.65 (6.19%) | ₹699.45 – ₹749.34 |
Nifty 500 Top Losers
| Stock | Close | Range |
|---|---|---|
| KSB | ₹999.79 (-79.97%) | ₹977.54 – ₹1,017.65 |
| JK Paper | ₹520.34 (-7.78%) | ₹498.95 – ₹529.54 |
| Axis Bank | ₹1,175.9 (-5.12%) | ₹1,155.5 – ₹1200 |
| Welspun Corp | ₹636.34 (-4.87%) | ₹634.59 – ₹662 |
| Indian Railway Finance Corporation | ₹184 (-4.31%) | ₹183 – ₹191.39 |
Nifty 51 to 500 Stocks To Watch for Tomorrow
Adani Energy (Bullish Pattern)
- Performance Overview: In the last 26 trading sessions, Adani Energy has closed higher 15 times and lower 11 times. That means it’s been on a generally positive trajectory, but not without some dips!
- Recent Trend: Adani Energy has been on a 5-day green streak, closing higher every day since Thursday, July 18, 2024.
- Returns: Adani Energy delivered a 2.62% return over the last 26 trading sessions. If you had invested ₹10,000, it would be worth ₹10,262 today.
- Financial Insight: In the past 12 months, Adani Energy has generated a revenue of ₹16,607.35 Crore and earned a profit of ₹1,137.28 Crore. This suggests a strong financial foundation.
- As of Thursday, July 25, 2024, Adani Energy has a Market Capital of ₹1,12,781.99 Crore.
- Summary: Adani Energy is showcasing a robust bullish pattern. It’s attracting investor interest. Want to dive deeper? Check out our analyses for both short-term and long-term growth prospects: Adani Energy Target for Tomorrow and Adani Energy Targets for 2024 & 2025.
Adani Energy Financial Performance
| Metric | Value | Description |
|---|---|---|
| Market Capital | 1,12,781.99 Crore | Market valuation of Adani Energy’s shares. |
| Revenue (TTM) | 16,607.35 Crore | Total revenue generated by Adani Energy over the past twelve months. |
| Net Income (TTM) | +1,137.28 Crore | Net Profit or Loss after all the expenses over the past twelve months. |
| Operating Margin | 23.33% | Income from operations as a percentage of revenue, before taxes and interest. |
| Profit Margin | 6.84% | Net income as a percentage of revenue, after all expenses. |
| Revenue Growth (Quarterly) | +40.2% | Change in revenue compared to the previous quarter. |
| Earnings Growth (YOY Quarterly) | -7.2% | Change in earnings compared to the same quarter last year. |
| Debt-to-Equity (D/E) Ratio | 270.52 | Company’s total debt divided by total shareholder equity. |
| Total Debt | 37,069.64 Crore | Sum of Adani Energy’s current & long-term financial obligations. |
| Total Cash | 1,920.37 Crore | Total amount of liquid funds available to Adani Energy. |
| Beta | 1.17 | Beta is greater than 1 indicating that the Adani Energy’s price is more volatile than the market. |
➲ Indian Railway Finance Corporation (Bearish Trend)
- Performance Overview: In the last 26 trading days, Indian Railway Finance Corporation has closed lower 15 times and higher 11 times.
- Recent Trend: Indian Railway Finance Corporation has been on a downward trend for the past 8 days, with no gains since Friday, July 12, 2024.
- Returns: Over the past 26 trading days, Indian Railway Finance Corporation delivered a 4.44% return. This means an investment of ₹10,000 would have grown to ₹10,444.
- Financial Insight: Over the past 12 months, Indian Railway Finance Corporation generated revenue of ₹6,558.37 Crore and achieved a profit of ₹6,412.1 Crore.
- As of Thursday, July 25, 2024, Indian Railway Finance Corporation has a Market Capital of ₹2,68,949.62 Crore.
- Summary: Indian Railway Finance Corporation is currently facing a bearish phase. We recommend investors closely monitor the stock’s performance, especially considering the potential for near-term fluctuations. It’s wise to keep an eye on the short-term price targets and the projected targets for 2024 and 2025.
Indian Railway Finance Corporation Financial Performance
| Metric | Value | Description |
|---|---|---|
| Market Capital | 2,68,949.62 Crore | Market valuation of Indian Railway Finance Corporation’s shares. |
| Revenue (TTM) | 6,558.37 Crore | Total revenue generated by Indian Railway Finance Corporation over the past twelve months. |
| Net Income (TTM) | +6,412.1 Crore | Net Profit or Loss after all the expenses over the past twelve months. |
| Operating Margin | 97.97% | Income from operations as a percentage of revenue, before taxes and interest. |
| Profit Margin | 97.77% | Net income as a percentage of revenue, after all expenses. |
| Revenue Growth (Quarterly) | +25.5% | Change in revenue compared to the previous quarter. |
| Earnings Growth (YOY Quarterly) | +29.29% | Change in earnings compared to the same quarter last year. |
| Debt-to-Equity (D/E) Ratio | 841.61 | Company’s total debt divided by total shareholder equity. |
| Total Debt | 4,13,891.69 Crore | Sum of Indian Railway Finance Corporation’s current & long-term financial obligations. |
| Total Cash | 957.16 Crore | Total amount of liquid funds available to Indian Railway Finance Corporation. |
| Beta | 0.49 | Beta is less than 1 indicating that the Indian Railway Finance Corporation’s price is less volatile than the market. |
Top Stocks That Created a New All Time High Today
Top Large Cap Stocks That Created a New All Time High Today
Companies with Market Capital more than 20,000 Crores| Stock | Close | New All-Time High (ATH) | Previous ATH | Previous ATH Date |
|---|---|---|---|---|
| Alembic Pharma | 1200.94 (+2.17%) | 1218.00 (+%) | Thu 01 Jan 1970 | |
| BASF | 6172.95 (+4.65%) | 6200.00 (+%) | Thu 01 Jan 1970 | |
| Federal Bank | 204.64 (+1.69%) | 205.00 (+%) | Thu 01 Jan 1970 | |
| Fortis | 503.39 (+4.21%) | 514.70 (+%) | Thu 01 Jan 1970 | |
| Glenmark Pharma | 1421.34 (-0.31%) | 1449.00 (+%) | Thu 01 Jan 1970 |
Top Mid Cap Stocks That Created a New All Time High Today
Companies with Market Capital between 5,000 Crores to 20,000 Crores| Stock | Close | New All-Time High (ATH) | Previous ATH | Previous ATH Date |
|---|---|---|---|---|
| Black Box | 435.35 (+4.99%) | 435.35 (+%) | Thu 01 Jan 1970 | |
| Electrosteel Castings | 211.30 (+0.73%) | 217.24 (+5.45%) | 206.00 | Mon 22 Apr 2024 |
| Epigral | 1731.00 (+4.27%) | 1776.84 (+24.69%) | 1424.90 | Mon 22 Apr 2024 |
| Gokaldas Exports | 979.65 (-0.66%) | 1042.09 (+%) | Thu 01 Jan 1970 | |
| Granules India | 551.00 (+2.42%) | 553.34 (+%) | Thu 01 Jan 1970 |
Top Small Cap Stocks That Created a New All Time High Today
Companies with Market Capital less than 5,000 Crores| Stock | Close | New All-Time High (ATH) | Previous ATH | Previous ATH Date |
|---|---|---|---|---|
| Ace Software Exports | 340.79 (+1.99%) | 340.79 (+126.77%) | 150.28 | Mon 01 Apr 2024 |
| Arvind SmartSpaces | 789.95 (+9.6%) | 791.00 (+5.36%) | 750.75 | Wed 03 Apr 2024 |
| Associated Alcohols | 762.04 (-0.03%) | 787.45 (+%) | Thu 01 Jan 1970 | |
| Antony Waste Handling | 814.09 (+3.13%) | 834.79 (+%) | Thu 01 Jan 1970 | |
| BCC Fuba India | 91.83 (+9.98%) | 91.83 (+%) | Thu 01 Jan 1970 |