Home / Mrf Soars To New Heights 58 52 Gain In 9 Months Investors Thrilled
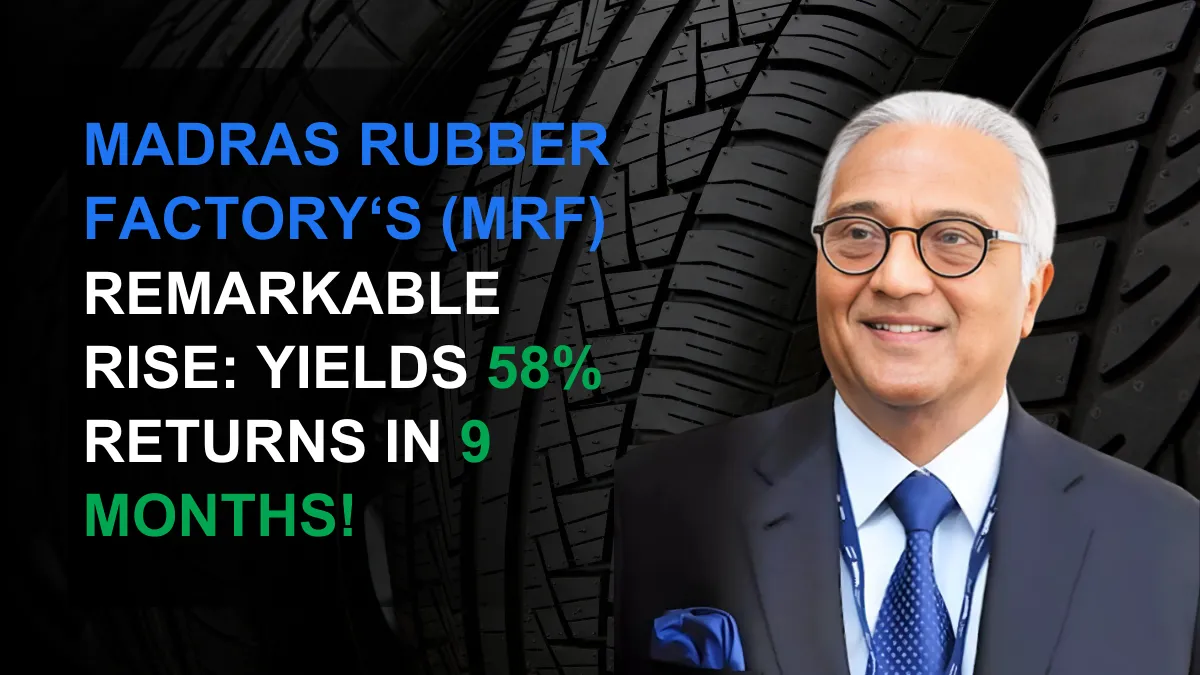
MRF SOARS TO NEW ALL-TIME HIGH: 58.52% GAIN from 52-Week Low IN 9 MONTHS, INVESTORS THRILLED!
Show Table of Contents
Table of Contents
- 1: Chart: MRF All Time High & 52 Week Low as of 29 Dec 2023
- 2: MRF’s Record Surge to a New All-Time High
- 2.1: Factors Contributing to a Stock’s All-Time High
- 2.2: Positive Earnings Reports
- 2.3: Favourable Industry Trends
- 2.4: Analyst Ratings
- 2.5: Potential Scenarios Following an All-Time High
- 3: MRF Stock Analysis: Potential Supports and Targets
- 3.1: KEY PERFORMANCE METRICS
- 3.1.1: MRF Fibonacci Retracement Or Support levels
- 3.1.2: MRF Fibonacci Extensions Or Target levels
- 4: Making Informed Investment Decisions
- 4.1: Company’s Financial Health
- 4.2: Industry Outlook
- 4.3: Market Sentiment
Chart: MRF All Time High & 52 Week Low as of 29 Dec 2023
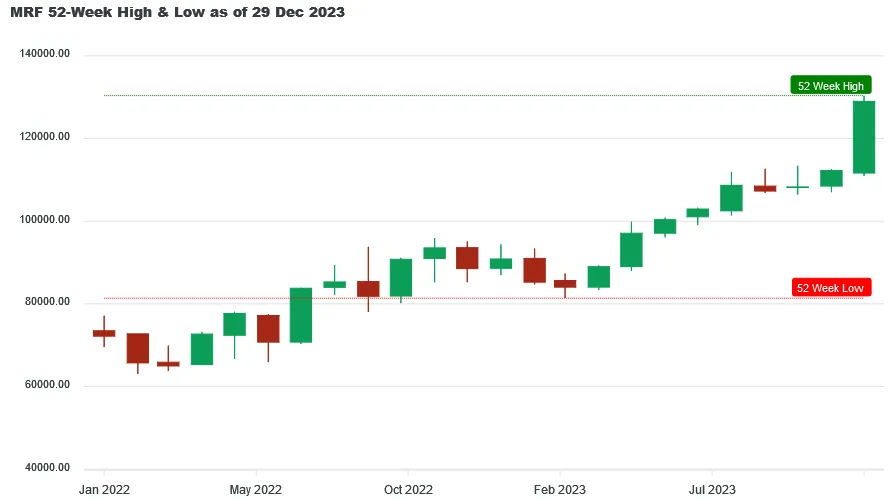
MRF hit its 52 week low of ₹81380.05 on 29 Mar 2023 and from there it move to ₹130399.35 creating a brand-new All Time High on 29 Dec 2023, giving a whopping 58.52% return in just 9 months and 0 days.
If you had invested ₹10,000 at its 52-week low price, your investment would have grown to ₹15,852 by 29 Dec 2023. This represents a gain of ₹5,852 in just 9 months and 0 days. Given MRF's strong recent performance, Lets find out what opportunities lies ahead for MRF
If you had invested ₹10,000 at its 52-week low price, your investment would have grown to ₹15,852 by 29 Dec 2023. This represents a gain of ₹5,852 in just 9 months and 0 days. Given MRF's strong recent performance, Lets find out what opportunities lies ahead for MRF
Stay ahead of the market! Get instant alerts on crucial market breakouts. Don't miss out on key opportunities!
Your phone number will be HIDDEN to other users.
MRF’s Record Surge to a New All-Time High
The all-time high of Madras Rubber Factory can be a result of many factors. Its previous all-time high, before correction, was made on 15 December 2023 at ₹ 1,21,193.35. It took 14 days to create a new all-time high at ₹ 1,30,399.35 on 29 December 2023. In between, it made a low of ₹ 1,15,500.05 on 21 December 2023, implying a correction of over 4%. It may signal a shift in the investors’ sentiment due to the company’s financial upturn or may represent overvaluation. Let’s examine the key drivers for its all-time high.
Factors Contributing to a Stock’s All-Time High
Positive Earnings Reports
- Since 2016, its revenue has consistently increased, except in 2020, when the COVID pandemic began. In FY23, it generated a revenue of ₹ 22991 crores.
- In the last three quarters, its net income has shown triple-digit growth year-on-year. In Q2 FY24, its net income increased by 351.76% and reached ₹ 587 crores.
- On observing the dividend data since 2016, the company has either kept its dividend the same or else increased its dividend compared to the previous year. Its payout ratio has consistently increased, and in 2022, it reached 9.65%.
Favourable Industry Trends
- As people’s disposable income increases, the demand for vehicles also increases. A surge in the automobile market will indirectly increase the demand for tires. MRF can have exclusive deals with car manufacturers to provide its tires with the new cars that are being manufactured to capture a more significant portion of indirect sales.
- Due to the weight dynamics of electric vehicles, regular tires cannot be used with them, which has given rise to a new segment of tyres and a level playing field for all the major tyre manufacturers to start. MRF can capitalise on the trend by making its products available in more places.
- As the world economy is getting more conscious about the effect of its businesses on the environment, more importance is being given to sustainability and eco-friendly tires. MRF can innovate in this segment to make its products desired not only in India but all over the world.
Analyst Ratings
Motilal Oswal Financial Services, in its November financial report, has given a “sell” rating to MRF shares with a target price of ₹ 97000. The revenue of the company was below estimate, but due to low raw material costs, it was able to beat the EBITDA margin. MRF’s competitive position has weakened over the past few years. It reflects the dilution of pricing power in the PCR and TBR segments. It is expected that MRF’s return ratio will be relatively lower than its peers in the coming two years.
Potential Scenarios Following an All-Time High
(Based on the chart of 1-month timeframe)
Converting numbers and candles into information can provide us with the market’s stance on the stock, which may help us make correct investment decisions. Since the listing of Madras Rubber Factory in January 2003, it has converted an investment of ₹ 914.8 into ₹ 130399.35, which means it gave 142x returns in almost 21 years. In April 2023, it started its bull rally with higher highs and higher lows every month, except in November 2023. We can expect the trends to continue so the investors may enter the stock at the price of their liking but keep the stop loss at the low made in the previous month.
MRF Stock Analysis: Potential Supports and Targets
Fri 29 Dec 2023 - In a remarkable market development, MRF has soared to ₹130399.35, setting a brand-new All Time High record! With this surge, there are chances of it becoming volatile, as many investors may like to book their profits by exiting or closing their positions. At this time potential investors and current stakeholders should keep an eye for opportunities for entry or exit.
Below you will find MRF's metrics highlight, potential support and targets derived using Fibonacci Retracement and Extensions method, where Golden Ratio is assumed to be a good support (entry point) and Golden Extension to be good resistance (target point)
KEY PERFORMANCE METRICS
| Metrics | Value | Occured On |
|---|---|---|
| Close Price | ₹129000.00 | Fri, 29 Dec 2023 |
| 52 Week High | ₹130399.35 | Fri, 29 Dec 2023 |
| 52 Week Low | ₹81380.05 | Wed, 29 Mar 2023 |
| All Time High | ₹130399.35 | Fri 29 Dec 2023 |
The above table shows that the close price of MRF on Fri, 29 Dec 2023 was ₹129000.00. Notably, the All-Time High is same as the 52-Week High, indicating that the all-time high was achieved recently and it cloud be a strong resistance level which would need great upward momentum to break.
It's possible that some investors might consider booking profits near the 130399.35 mark, which could apply downward pressure on the stock price.
But what does this newly created milestone signify for potential investors? Lets find out.
MRF Fibonacci Retracement Or Support levels
For those considering an entry, the Golden Ratio (61.8%) retracement level of ₹100105 offers a promising point, given the likelihood of a pullback from these levels as new investors might come in at these levels.
| Retracement or Support Levels | Values | |
|---|---|---|
| S1 | 23.6% | ₹118830 |
| S2 | 38.2% | ₹111673 |
| S3 | 50.0% | ₹105889 |
| S4 | 61.8% (Golden Ratio) | ₹100105 |
| S5 | 78.6% | ₹91870 |
| S6 | 52 Week Low | ₹81380 |
Note: This table was last updated on Fri, 29 Dec 2023.
MRF Fibonacci Extensions Or Target levels
For those considering an exit, the Golden Extension (161.8%) level of ₹160693 offers a promising point, given the likelihood of a downward momentum from these levels as investors might start booking their profits at these levels.
| Extensions or Target Levels | Values | |
|---|---|---|
| T1 | 52 Week High | ₹130399 |
| T2 | 138.2% | ₹149124 |
| T3 | 161.8% (Golden Extension) | ₹160693 |
| T4 | 200% | ₹179418 |
| T5 | 261.8% | ₹209712 |
Note: This table was last updated on Fri, 29 Dec 2023.
Making Informed Investment Decisions
For any stock, reaching an all-time high is a significant milestone. Still, conducting thorough research and considering various factors is essential before making investment decisions. To make informed choices that align with your investment goals and risk tolerance, one needs to analyse the company’s fundamentals, industry trends, management’s strategy, and overall market conditions.
Company’s Financial Health
- In 2022, MRF had a debt of ₹ 3002 crores with a negative free cash flow of ₹ 689 crores and cash & equivalents of ₹ 258 crores. It shows a huge difference between the debt and funds, which makes it essential for the company to increase the amount under free cash flow or cash & equivalents.
- In the short term, it has a liability of ₹ 7495 crores covered by assets of ₹ 9244 crores. The assets of ₹ 15228 crores cover its long-term liabilities of ₹ 2269 crores. It may need to sell a few of its assets to increase the funds under free cash flow.
Industry Outlook
- Technological advancements are making it possible to create new products with varied uses in the industries. The tyre industry can make new advanced materials that can be used to produce longer-lasting and higher-performance tires.
- As the tyre market matures, the rising demand for replacement tires will become consistent, thus making it difficult for new entrants in the market to capture a significant market share.
Market Sentiment
Madras Rubber Factory’s (MRF) all-time high of ₹ 1,30,399.35 is a result of robust financial performance and favourable industry trends. The consistent revenue growth since 2016, along with a 351.76% jump in Q2 FY24 net income, signals strong fundamentals. Industry wise the demand for the products in its segment is expected to increase. Still, Motilal Oswal’s “sell” rating due to competitive challenges and a diluted market position adds a note of caution. Investors need to conduct detailed research, considering factors like company fundamentals, industry trends, and financial health, to make informed investment decisions.


