Home / Man Industries Remarkable 279 Surge Takes It To All Time High
Man Industries Remarkable 279% Surge Takes it to All-Time High
Show Table of Contents
Table of Contents
- 1: Chart: MANINDS All Time High & 52 Week Low as of 08 Dec 2023
- 2: Understanding the Significance of an All-Time High
- 2.1: Factors Contributing to a Stock’s All-Time High
- 2.2: Positive Earnings Reports
- 2.3: Favorable Industry Trends
- 2.4: Positive Analyst Ratings
- 2.5: Potential Scenarios Following an All-Time High
- 3: MANINDS Stock Analysis: Potential Supports and Targets
- 3.1: KEY PERFORMANCE METRICS
- 3.1.1: MANINDS Fibonacci Retracement Or Support levels
- 3.1.2: MANINDS Fibonacci Extensions Or Target levels
- 4: Making Informed Decisions
- 4.1: Company’s Financial Health
- 4.2: Industry Outlook
- 4.3: Market Sentiment
Chart: MANINDS All Time High & 52 Week Low as of 08 Dec 2023
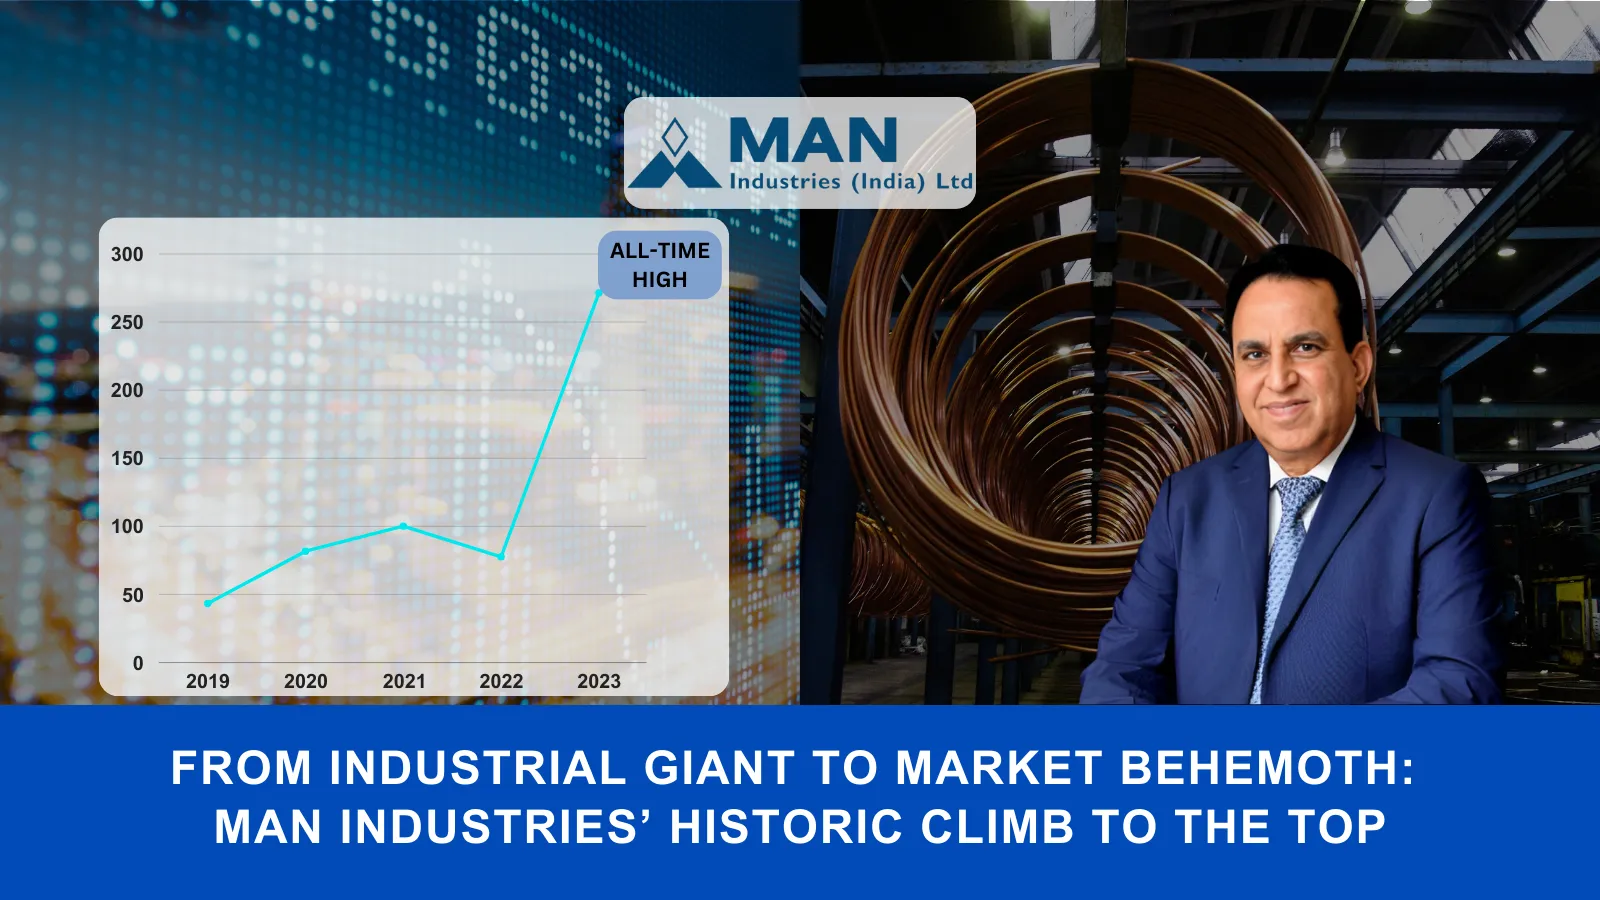
[getCandleChart symbol="MANINDS" start="26 Dec 2021" end="08 Feb 2024" title="MANINDS 52-Week High & Low as of 08 Dec 2023" 52weekhigh="288.00" high52weekdate="20231207" 52weeklow="71.45" low52weekdate="20221226" todayDate="20231208" close="271.00"]MANINDS hit its 52 week low of ₹71.45 on 26 Dec 2022 and from there it move to ₹288.00 creating a brand-new All Time High on 07 Dec 2023, giving a whopping 279.29% return in just 11 months and 12 days.If you had invested ₹10,000 at its 52-week low price, your investment would have grown to ₹37,929 by 08 Dec 2023. This represents a gain of ₹27,929 in just 11 months and 12 days. Given MANINDS's strong recent performance, Lets find out what opportunities lies ahead for MANINDS
Understanding the Significance of an All-Time High
Most of the time, the share price remains range-bound. Considering the hundreds of securities listed on the stock exchange, it becomes difficult to trade on them all. To narrow it down, investors zero down on stocks with the most activity, which can be found among the stocks nearing their 52-week high/low. It may represent one of the two possibilities.
- Optimism & Momentum: The stock has strong fundamentals, and investor sentiment is positive.
- Caution for Overvaluation: While the high price is indicative of good performance, it may also suggest that the stock is overvalued, potentially requiring careful consideration.
Factors Contributing to a Stock’s All-Time High
Positive Earnings Reports
- In Q2 FY23, Man Industries’ revenue increased by 118.89% year-on-year.
- Even though its revenue has doubled quarter-on-quarter, its operating expenses have shown a marginal growth of 21.10%. It may indicate that the company has achieved an economy of scale.
- Even after the economy of scale, its net income increased by over 3 times quarter-on-quarter due to the reduced losses under non-operating income.
Favorable Industry Trends
- An increase in energy demand with the increase in the size of the economy is evident. A permanent solution for the reduction of the cost of transportation of oil & gas to different locations, which is pipeline infrastructure, is being implemented. Man industries can capitalise on this by providing specially manufactured pipes meant for the transportation of oil & gas.
- India’s food security achievement depends on large-scale irrigation for efficient usage of cultivable land, which requires proper water supply. Man Industries can rely on water supply and irrigation projects to increase its order book and revenue.
- Government initiatives such as “Har Ghar Jal” have started to provide basic piping infrastructure to provide water to every house. Supplying water to faraway locations requires large-diameter pipes, which is a speciality of Man Industries.
Positive Analyst Ratings
According to Simple Wall Street, it is trading 90.9% below its fair value estimate. Its earnings grew 81.7% over the last year. Its current net profit margin of 4.1% is higher than the profit margin of last year, i.e., 2.8%. The dividend payments have remained volatile in the last 10 years. According to their Snowflake analysis, Man Industries has a flawless balance sheet with a solid track record.
Potential Scenarios Following an All-Time High
(Based on the chart of 1-day timeframe)
Converting numbers and candles into information can provide us with the market’s stance on the stock, which may help us in making correct investment decisions. Its all-time high was made after a gap of more than 11 years; thus, the data is insufficient to find a trend based on it. Our observations will be based on the 52-week high. We have observed the chart behaviour from 2015 onwards.
Limiting our study to the 52-week highs that were made after a gap of at least a month, few interesting observations can be made. Most of the time, when the 52-week high is broken, we have seen upward movement in the share price with high probability, but it is accompanied by high volatility. Sometimes, the stock has corrected by more than 20% before starting the upward movement.
MANINDS Stock Analysis: Potential Supports and Targets
As MANINDS yesterday (Thu 07 Dec 2023) created a new 52 week high there are chances of it becoming volatile. At this time potential investors and investors should keep an eye for opportunities for entry or exit. Below you will find MANINDS's metrics highlight, potential support and targets derived using Fibonacci Retracement and Extensions method, where Golden Ratio is assumed to be a good support (entry point) and Golden Extension to be good resistance (target point)
KEY PERFORMANCE METRICS
| Metrics | Value | Occured On |
|---|---|---|
| Close Price | ₹271.00 | Fri, 08 Dec 2023 |
| 52 Week High | ₹288.00 | Thu, 07 Dec 2023 |
| 52 Week Low | ₹71.45 | Mon, 26 Dec 2022 |
| All Time High | ₹332.89 | Fri 13 Jul 2007 |
The above table shows that the close price of MANINDS on Fri, 08 Dec 2023 was ₹271.00. The next target for it could be the All-Time High of ₹332.89 which is ₹61.89 more than from its close price of ₹271.00.
It's possible that some investors might consider booking profits near the 288.00 mark, which could apply downward pressure on the stock price.
But what does this newly created milestone signify for potential investors? Lets find out.
MANINDS Fibonacci Retracement Or Support levels
For those considering an entry, the Golden Ratio (61.8%) retracement level of ₹154 offers a promising point, given the likelihood of a pullback from these levels as new investors might come in at these levels.
| Retracement or Support Levels | Values | |
|---|---|---|
| S1 | 23.6% | ₹236 |
| S2 | 38.2% | ₹205 |
| S3 | 50.0% | ₹179 |
| S4 | 61.8% (Golden Ratio) | ₹154 |
| S5 | 78.6% | ₹117 |
| S6 | 52 Week Low | ₹71 |
Note: This table was last updated on Fri, 08 Dec 2023.
MANINDS Fibonacci Extensions Or Target levels
For those considering an exit, the Golden Extension (161.8%) level of ₹421 offers a promising point, given the likelihood of a downward momentum from these levels as investors might start booking their profits at these levels.
| Extensions or Target Levels | Values | |
|---|---|---|
| T1 | 52 Week High | ₹288 |
| T2 | 138.2% | ₹370 |
| T3 | 161.8% (Golden Extension) | ₹421 |
| T4 | 200% | ₹504 |
| T5 | 261.8% | ₹638 |
Note: This table was last updated on Fri, 08 Dec 2023.
Making Informed Decisions
For any stock, reaching an all-time high is a significant milestone. Still, conducting thorough research and considering various factors is essential before making investment decisions. To make informed choices that align with your investment goals and risk tolerance, one needs to analyse the company’s fundamentals, industry trends, management’s strategy, and overall market conditions.
Company’s Financial Health
- In FY23, REC Limited had a debt of ₹ 299 crores with a negative free cash flow of ₹ 363 crores and cash & equivalents of ₹ 170 crores. It needs to increase its funds to a level at which it can easily service its debt and still have enough free cash flow to face any financial difficulty in future.
- In the short term, it has a liability of ₹ 564 crores covered by assets of ₹ 940 crores. The assets of ₹788 crores cover its long-term liabilities of ₹ 159 crores.
Industry Outlook
- Industry can reduce the cost of production with new, cost-effective materials and efficient production processes. It can leverage the advancement in technology to make it possible.
- It is expected that for the next few years, India will be one of the fastest-growing economies. It may result in a change in the global trade dynamics and open new markets for the Indian iron & steel products industry.
Market Sentiment
In Q2 FY23, Man Industries’ impressive revenue growth had only a tiny effect on the operating expense. It may indicate that in the past, the company was not working at its full capacity. Investors may need to see whether this increase in revenue was a one-time event due to a big order or if the trend will continue. It already serves the international market, and once the global trade dynamics shift in favour of Indian companies, it may see a sudden increase in revenue due to the availability of idle manufacturing capacity. It may not be adequately equipped to face any adverse financial conditions due to huge debt and a negative cash flow, so investors may need to be cautious and make informed investment decisions.