Home / Tue 30 Apr 2024 Stocks To Watch
Stock To Watch Today – 30 Apr 2024: Piccadily Agro, Gallantt Metal, Mahindra & More!

Show Table of Contents
Table of Contents
- 1: Stocks To Watch for Today!
- 1.1: ➲ Gallantt Metal (Bullish Pattern)
- 1.1.1: Gallantt Metal Financial Performance
- 1.2: ➲ Piccadilly Agro Industries (Bullish Pattern)
- 1.2.1: Piccadilly Agro Industries Financial Performance
- 1.3: ➲ Mahindra Holidays & Resorts (Bullish Pattern)
- 1.3.1: Mahindra Holidays & Resorts Financial Performance
- 1.4: ➲ Aayush Food and Herbs (Bullish Pattern)
- 1.4.1: Aayush Food and Herbs Financial Performance
- 1.5: ➲ Sun Pharma Advanced Research Company (Bearish Pattern)
- 1.5.1: Sun Pharma Advanced Research Company Financial Performance
- 1.6: ➲ TIRTH PLASTIC LTD. (Bearish Pattern)
- 1.6.1: TIRTH PLASTIC LTD. Financial Performance
Stocks To Watch for Today!
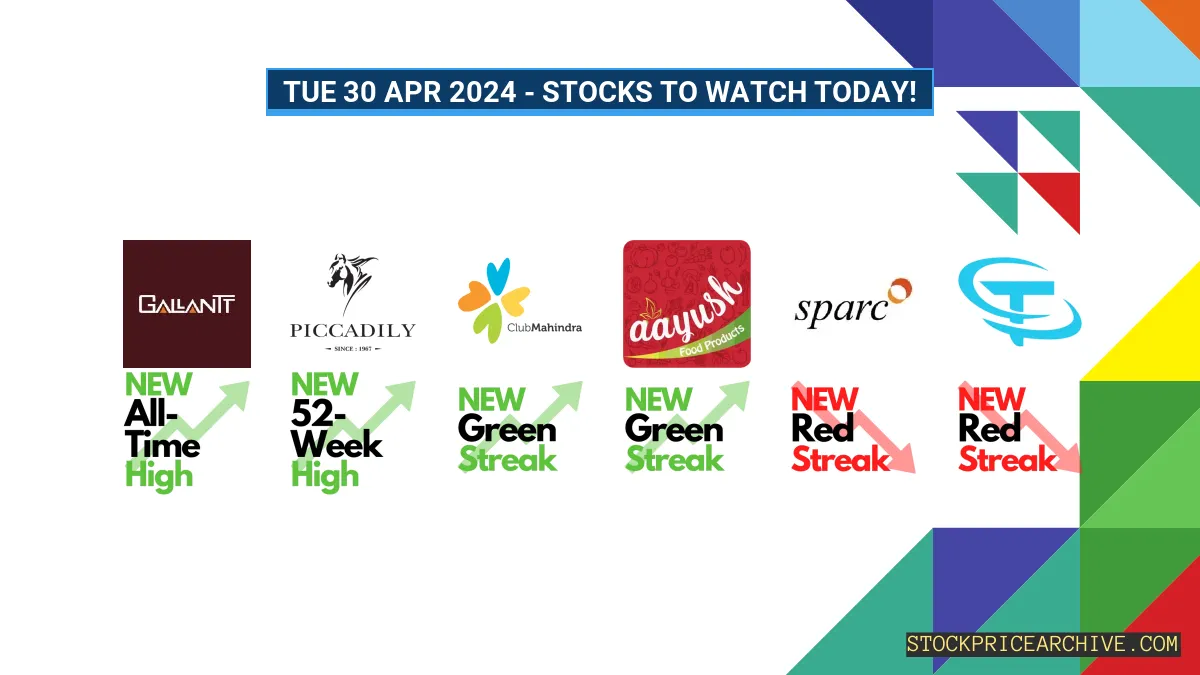
We have identified some stocks that have potential to give big moves today.
| Company | Yesterday Close | Current Trend |
|---|---|---|
| Gallantt Metal | 294.50 (+5.14%) | Bullish: 12 Day Green Streak, Created New All-Time High |
| Piccadily Agro Industries | 635.50 (+30.25%) | Bullish: 11 Day Green Streak, Created New 52-Week High |
| Mahindra Holidays & Resorts | 433.70 (+0.45%) | Bullish: 9 Day Green Streak |
| Aayush Food and Herbs | 252.05 (+4.9%) | Bullish: 22 Day Green Streak (Small Cap Stock) |
| Sun Pharma Advanced Research Company | 244.50 (-12.86%) | Bearish: 13 Day Red Streak |
| TIRTH PLASTIC LTD. | 33.20 (-1.74%) | Bearish: 21 Day Red Streak (Small Cap Stock) |
You might be wondering, “Why these stocks?” Well, prepare to be enlightened as we share the captivating trends that captured our interest!
➲ Gallantt Metal (Bullish Pattern)
Below chart shows daily close price of Gallantt Metal

- Gallantt Metal created a new ATH of ₹299 in the last trading session breaking its previous ATH of ₹276.29 which was created 6 days ago.
- Performance Overview: Within the span of the previous 22 sessions, Gallantt Metal successfully recorded an upward trend on 17 occasions, equivalent to a 77.27% success ratio.
- Recent Trend: Since Tue 09 Apr 2024, Gallantt Metal has not seen a single red day, making a 12-day streak of gains with a 47.88% increase from ₹199.14 to ₹294.5.
- Returns: Amidst 22 trading periods, Gallantt Metal’s performance marked a 50.06% gain, boosting ₹10,000 to an impressive ₹15,006.
- Financial Insight: In their 2023-Q3 Income Statement Gallantt Metal reported a net profit of ₹51.97 Crore with Earning Per Share (EPS) of 2.15 for the Quarter. Additionally, as of Mon 29 Apr 2024, it has a Market Capital of ₹7,055.04 Crore.
- Future Outlook: Gallantt Metal exhibits a robust bullish pattern. Investors should monitor its price movements and targets for both short-term and long-term growth prospects: Checkout Gallantt Metal Target for Tomorrow and Gallantt Metal Targets for 2024 & 2025.
Gallantt Metal Financial Performance
| Metric | Value | Description |
|---|---|---|
| Revenue Growth (Quarterly) | +5.6% | Change in revenue compared to the previous quarter. |
| Earnings Growth (YOY Quarterly) | +148.6% | Change in earnings compared to the same quarter last year. |
| Operating Margin | 7.37% | Income from operations as a percentage of revenue, before taxes and interest. |
| Profit Margin | 4.79% | Net income as a percentage of revenue, after all expenses. |
| Debt-to-Equity (D/E) Ratio | 21.26 | Company’s total debt divided by total shareholder equity. |
| Beta | 1.07 | Beta is greater than 1 indicating that the Gallantt Metal’s price is more volatile than the market. |
➲ Piccadilly Agro Industries (Bullish Pattern)
Below chart shows daily close price of Piccadilly Agro Industries

- Piccadilly Agro Industries stock achieved a new 52-Week High of ₹635.5 on Monday, exceeding the previous record of ₹549 set 5 days earlier.
- Performance Overview: Over the past 22 sessions, Piccadilly Agro Industries exhibited an upward trend 18 times, resulting in a 81.81% success ratio.
- Recent Trend: Piccadilly Agro Industries has sustained a positive trajectory for 11 days since Wednesday, April 10th, 2024, leading to a 70.37% increase in its value, from₹373 to ₹635.5.
- Returns: Within just 22 trading sessions under Piccadilly Agro Industries’s direction, investors witnessed a return of 105.33%, transforming a ₹10,000 investment into ₹20,533.
- Financial Insight: Piccadilly Agro Industries’s 2023-Q3 Income Statement revealed a net profit of ₹44.35 Crore and an Earning Per Share (EPS) of 4.69 for the Quarter. As of Monday, April 29th, 2024, it boasts a Market Capital of ₹5,709.88 Crore.
- Future Outlook: Piccadilly Agro Industries displays a robust bullish pattern. Investors should monitor its price movements to identify both short-term and long-term growth opportunities: Checkout Piccadilly Agro Industries Target for Tomorrow and Piccadilly Agro Industries Targets for 2024 & 2025.
Piccadilly Agro Industries Financial Performance
| Metric | Value | Description |
|---|---|---|
| Revenue Growth (Quarterly) | +50.92% | Change in revenue compared to the previous quarter. |
| Earnings Growth (YOY Quarterly) | +30.65% | Change in earnings compared to the same quarter last year. |
| Operating Margin | 20.92% | Income from operations as a percentage of revenue, before taxes and interest. |
| Profit Margin | 53.91% | Net income as a percentage of revenue, after all expenses. |
| Debt-to-Equity (D/E) Ratio | 0.5 | Company’s total debt divided by total shareholder equity. |
➲ Mahindra Holidays & Resorts (Bullish Pattern)
Below chart shows daily close price of Mahindra Holidays & Resorts

- Performance Overview: In the last 22 trading sessions, Mahindra Holidays & Resorts has closed the day in green 63.63% times i.e 14 times in 22 sessions.
- Recent Trend: Since Mon 15 Apr 2024, Mahindra Holidays & Resorts has not seen a single red day, marking a 9-day streak of gains with a 10.77% increase from ₹391.5 to ₹433.7.
- Returns: In the span of 22 sessions, Mahindra Holidays & Resorts’s approach led to a 9.79% growth, elevating a ₹10,000 investment to ₹10,979.
- Financial Insight: In their 2023-Q3 Income Statement Mahindra Holidays & Resorts reported a net profit of ₹10.52 Crore with Earning Per Share (EPS) of 0.58 for the Quarter. Additionally, as of Mon 29 Apr 2024, it has a Market Capital of ₹8,748.7 Crore.
- Future Outlook: Mahindra Holidays & Resorts exhibits a robust bullish pattern. Investors should monitor its price movements targets for both short-term and long-term growth prospects: Checkout Mahindra Holidays & Resorts Target for Tomorrow and Mahindra Holidays & Resorts Targets for 2024 & 2025.
Mahindra Holidays & Resorts Financial Performance
| Metric | Value | Description |
|---|---|---|
| Revenue Growth (Quarterly) | +12.4% | Change in revenue compared to the previous quarter. |
| Earnings Growth (YOY Quarterly) | +46% | Change in earnings compared to the same quarter last year. |
| Operating Margin | 12.71% | Income from operations as a percentage of revenue, before taxes and interest. |
| Profit Margin | 4.27% | Net income as a percentage of revenue, after all expenses. |
| Debt-to-Equity (D/E) Ratio | 513.39 | Company’s total debt divided by total shareholder equity. |
| Beta | 0.18 | Beta is less than 1 indicating that the Mahindra Holidays & Resorts’s price is less volatile than the market. |
➲ Aayush Food and Herbs (Bullish Pattern)
Below chart shows daily close price of Aayush Food and Herbs

- Performance Overview: In the last 22 trading sessions, Aayush Food and Herbs has closed the day in the green 100% of the time, that’s 22 times out of 22 sessions.
- Recent Trend: Aayush Food and Herbs’s bullish run for 22 days since Tue 26 Mar 2024 has resulted in a significant 49.14% jump in price, from ₹169 to ₹252.05.
- Returns: In just 22 trading sessions under Aayush Food and Herbs’s guidance, the return was 49.58%, turning a ₹10,000 investment into ₹14,958.
- Financial Insight: In their 2023-Q3 Income Statement Aayush Food and Herbs reported a net profit of ₹2.97 Lakh with Earnings Per Share (EPS) of 0.091 for the Quarter. As of Mon 29 Apr 2024, it has a Market Capital of ₹89.9 Crore.
- Future Outlook: Aayush Food and Herbs exhibits a strong bullish pattern. Investors are advised to monitor price movements and targets for both short-term and long-term growth prospects: Checkout Aayush Food and Herbs Target for Tomorrow and Aayush Food and Herbs Targets for 2024 & 2025.
Aayush Food and Herbs Financial Performance
| Metric | Value | Description |
|---|---|---|
| Revenue Growth (Quarterly) | -100% | Change in revenue compared to the previous quarter. |
| Operating Margin | -3.51% | Income from operations as a percentage of revenue, before taxes and interest. |
| Profit Margin | 6.26% | Net income as a percentage of revenue, after all expenses. |
➲ Sun Pharma Advanced Research Company (Bearish Pattern)
Below chart shows daily close price of Sun Pharma Advanced Research Company

- Performance Overview: In the last 22 trading sessions, Sun Pharma Advanced Research Company has closed the day in red 68.18% times, i.e., 15 times in 22 sessions.
- Recent Trend: From Mon 08 Apr 2024 to now, Sun Pharma Advanced Research Company hasn’t closed in the green, marking a 13-day streak and facing a price drop of -46.3% to ₹244.5.
- Returns: Amidst 22 trading periods, Sun Pharma Advanced Research Company’s performance marked a -35.12% reduction, lowering ₹10,000 to ₹6,488.
- Financial Insight: In their 2023-Q3 Income Statement Sun Pharma Advanced Research Company reported a net loss of ₹99.65 Crore with Earning Per Share (EPS) of -3.07 for the Quarter. As of Mon 29 Apr 2024, it has a Market Capital of ₹8,820.58 Crore.
- Future Outlook: Sun Pharma Advanced Research Company exhibits a bearish pattern. Investors should observe its price movements for both short-term and long-term growth prospects. Checkout Sun Pharma Advanced Research Company Target for Tomorrow and Sun Pharma Advanced Research Company Targets for 2024 & 2025.
Sun Pharma Advanced Research Company Financial Performance
| Metric | Value | Description |
|---|---|---|
| Revenue Growth (Quarterly) | -89.4% | Change in revenue compared to the previous quarter. |
| Operating Margin | -763.21% | Income from operations as a percentage of revenue, before taxes and interest. |
| Profit Margin | 28.14% | Net income as a percentage of revenue, after all expenses. |
| Debt-to-Equity (D/E) Ratio | 4.28 | Company’s total debt divided by total shareholder equity. |
| Beta | 0.74 | Beta is less than 1, indicating that Sun Pharma Advanced Research Company’s price is less volatile than the market. |
➲ TIRTH PLASTIC LTD. (Bearish Pattern)
Greetings, investors! Let’s dive into the recent performance of TIRTH PLASTIC LTD. and explore its future prospects.

- Performance Overview: TIRTH PLASTIC LTD. has shown a notable downward trend lately. In the past 22 trading sessions, 21 (95.45%) have closed lower than their opening prices.
- Recent Trend: Since March 26th, 2024, TIRTH PLASTIC LTD. has consistently closed in the red for 21 days. This has led to a significant -51.95% decline, from ₹69.09 to ₹33.2.
- Returns: Over the past 22 days, a ₹10,000 investment in TIRTH PLASTIC LTD. would have dwindled to ₹4,804.99, reflecting a -51.95% loss.
- As of April 29th, 2024, TIRTH PLASTIC LTD. has a Market Capital of ₹15.55 Crore.
- Future Outlook: TIRTH PLASTIC LTD. currently displays a bearish trend. For informed decisions, consider exploring our short-term and long-term price targets: TIRTH PLASTIC LTD. Target for Tomorrow and TIRTH PLASTIC LTD. Targets for 2024 & 2025.
TIRTH PLASTIC LTD. Financial Performance
| Metric | Value | Description |
|---|


