Home / Vodafone Idea Skyrockets From 52 Week Low Gaining 196 49 In 9 Months
Vodafone Idea Skyrockets from 52-Week Low, Gaining 196.49% in 9+ Months

Show Table of Contents
Table of Contents
- 1: Chart: Vodafone Idea 52 Week High & 52 Week Low as of 01 Jan 2024
- 2: Vodafone Idea’s Record Surge to a New 52-Week High
- 2.1: Factors Contributing to a Stock’s 52-Week High
- 2.2: Positive Earnings Reports
- 2.3: Favorable Industry Trends
- 2.4: Positive Analyst Ratings
- 2.5: Potential Scenarios Following a 52-Week High
- 3: Vodafone Idea Stock Analysis: Potential Supports and Targets
- 3.1: KEY PERFORMANCE METRICS
- 3.1.1: Vodafone Idea Fibonacci Retracement Or Support levels
- 3.1.2: Vodafone Idea Fibonacci Extensions Or Target levels
- 4: Making Informed Investment Decisions
- 4.1: Company’s Financial Health
- 4.2: Industry Outlook
- 4.3: Market Sentiment
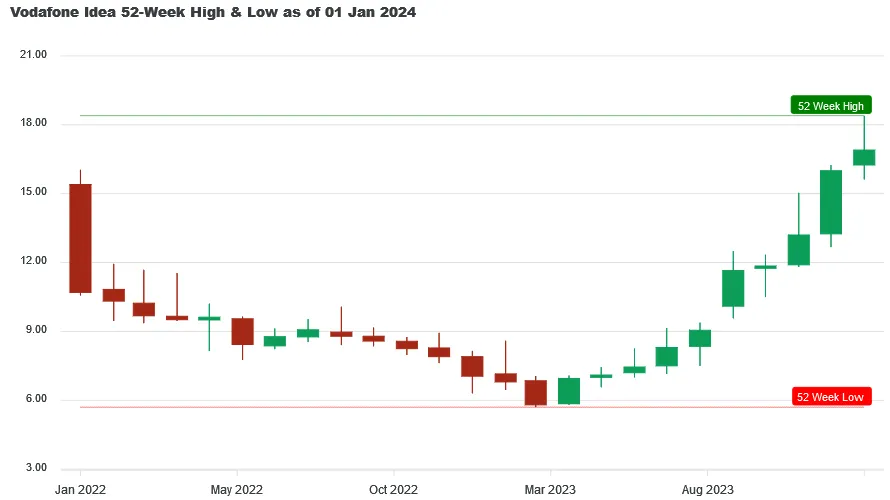
Chart: Vodafone Idea 52 Week High & 52 Week Low as of 01 Jan 2024

Vodafone Idea hit its 52 week low of ₹5.70 on 31 Mar 2023 and from there it move to ₹18.40 creating a brand-new 52 Week High on 01 Jan 2024, giving a whopping 196.49% return in just 9 months and 1 days.
If you had invested ₹10,000 at its 52-week low price, your investment would have grown to ₹29,649 by 01 Jan 2024. This represents a gain of ₹19,649 in just 9 months and 1 days. Given IDEA's strong recent performance, Lets find out what opportunities lies ahead for IDEA
If you had invested ₹10,000 at its 52-week low price, your investment would have grown to ₹29,649 by 01 Jan 2024. This represents a gain of ₹19,649 in just 9 months and 1 days. Given IDEA's strong recent performance, Lets find out what opportunities lies ahead for IDEA
Stay ahead of the market! Get instant alerts on crucial market breakouts. Don't miss out on key opportunities!
Your phone number will be HIDDEN to other users.
Vodafone Idea’s Record Surge to a New 52-Week High
The 52-week high of Vodafone Idea can be a result of many factors. Its previous 52-week high was made on 20 November 2023 at ₹ 15.05. It took 1 month and 12 days to create a new 52-week high at ₹ 18.4 on 01 January 2024. In between, it made a low of ₹ 12.65 on 08 December 2023, implying a correction of over 15.94%. It may represent a change in the investors’ sentiment about the company due to improved financial condition or may represent overvaluation. Let’s go through the factors contributing to its all-time high.
Factors Contributing to a Stock’s 52-Week High
Positive Earnings Reports
- In FY23, its revenue increased by 9.48% quarter-on-quarter; however, its operating expense improved by 3.78%
- Since 2020, Vodafone Idea has continuously improved its net margin to -69.5% in 2022. Its net income for FY23 was ₹ 29301 crores.
- Even though its revenue increased by ₹ 60 crores quarter-on-quarter, the gross profit saw an improvement of ₹ 83 crores due to the lower cost of goods sold.
Favorable Industry Trends
- The demand for data services and consumption of data by consumers on a daily basis is increasing at a rapid pace. Vodafone can focus on providing reliable connectivity at a faster internet speed to capture and maintain a significant population as a customer base.
- As more people upgrade to 5G technology-based devices, the companies whose infrastructure is in line to use the new technology are positioned to benefit greatly from it. Vodafone Idea can increase the speed of its infrastructure upgrade and focus on densely populated areas to earn significant revenue at a lower spending cost.
- COVID-19 pandemic-induced remote work culture has introduced the world to a new way of work that can help them achieve work-life balance. This change has made reliable communication services a necessity. Vodafone Idea can play a crucial role in bridging the gap between the requirement and quality of supply already available in the market.
Positive Analyst Ratings
According to Simply Wall Street, based on the discounted cash flow model, the fair value of Vodafone Idea’s share is ₹ 31.67. However, its CMP is ₹ 16, which means the stock is 49.5% undervalued. It has a price-to-sales ratio of 1.8x, which is lower than the peer average of 2.5x, thus making it undervalued. The company has not become profitable for a long time, and it is expected to remain unprofitable over the next 3 years.
Potential Scenarios Following a 52-Week High
Converting numbers and candles into information can provide us with the market’s stance on the stock, which may help us make correct investment decisions. Since the listing of Vodafone Idea Limited in March 2007, it has converted an investment of ₹ 51.35 into ₹ 18.4, which means it gave 0.35x returns in almost 17 years. In April 2023, it started its bull rally with higher highs and higher lows every month, except in October 2023. We can expect the trends to continue so the investors may enter the stock at the price of their liking but keep the stop loss at the low made in the previous month.
Vodafone Idea Stock Analysis: Potential Supports and Targets
As Vodafone Idea yesterday (Mon 01 Jan 2024) created a new 52 week high there are chances of it becoming volatile. At this time potential investors and investors should keep an eye for opportunities for entry or exit. Below you will find Vodafone Idea's metrics highlight, potential support and targets derived using Fibonacci Retracement and Extensions method, where Golden Ratio is assumed to be a good support (entry point) and Golden Extension to be good resistance (target point)
KEY PERFORMANCE METRICS
| Metrics | Value | Occured On |
|---|---|---|
| Close Price | ₹16.05 | Tue, 02 Jan 2024 |
| 52 Week High | ₹18.40 | Mon, 01 Jan 2024 |
| 52 Week Low | ₹5.70 | Fri, 31 Mar 2023 |
| All Time High | ₹123.00 | Fri 17 Apr 2015 |
The above table shows that the close price of Vodafone Idea on Tue, 02 Jan 2024 was ₹16.05. The next target for it could be the All-Time High of ₹123.00 which is ₹106.95 more than from its close price of ₹16.05.
It's possible that some investors might consider booking profits near the 18.40 mark, which could apply downward pressure on the stock price.
But what does this newly created milestone signify for potential investors? Lets find out.
Vodafone Idea Fibonacci Retracement Or Support levels
For those considering an entry, the Golden Ratio (61.8%) retracement level of ₹10 offers a promising point, given the likelihood of a pullback from these levels as new investors might come in at these levels.
| Retracement or Support Levels | Values | |
|---|---|---|
| S1 | 23.6% | ₹15 |
| S2 | 38.2% | ₹13 |
| S3 | 50.0% | ₹12 |
| S4 | 61.8% (Golden Ratio) | ₹10 |
| S5 | 78.6% | ₹8 |
| S6 | 52 Week Low | ₹5 |
Note: This table was last updated on Tue, 02 Jan 2024.
Vodafone Idea Fibonacci Extensions Or Target levels
For those considering an exit, the Golden Extension (161.8%) level of ₹26 offers a promising point, given the likelihood of a downward momentum from these levels as investors might start booking their profits at these levels.
| Extensions or Target Levels | Values | |
|---|---|---|
| T1 | 52 Week High | ₹18 |
| T2 | 138.2% | ₹23 |
| T3 | 161.8% (Golden Extension) | ₹26 |
| T4 | 200% | ₹31 |
| T5 | 261.8% | ₹38 |
Note: This table was last updated on Tue, 02 Jan 2024.
Also read: Vodafone Idea Share Price Target From 2025 to 2039
Making Informed Investment Decisions
For any stock, reaching an all-time high is a significant milestone. Still, conducting thorough research and considering various factors is essential before making investment decisions. To make informed choices that align with your investment goals and risk tolerance, one needs to analyze the company’s fundamentals, industry trends, management’s strategy, and overall market conditions.
Company’s Financial Health
- In 2022, Vodafone India had a debt of ₹ 2,38,000 crores covered by a free cash flow of ₹ 12,927 crores and cash & equivalents of ₹ 639 crores. It shows a huge difference between the debt and funds, which makes it important for the company to increase the amount under free cash flow or cash & equivalents.
- In the short term, it has a liability of ₹ 60,023 crores covered by assets of ₹ 11,813 crores. The assets of ₹ 2,18,000 crores do not fully cover its long-term liabilities of ₹ 2,44,00 crores. There is a significant gap between assets & liabilities in the short term, which indicates that the company may need to sell a few of its long-term assets to fulfil the obligation for short-term liabilities.
Industry Outlook
- The Internet of Things (IoT) is not a new technology in the business-to-business segment, but in future, it will also be widely used amongst everyday consumers. The telecom industry can prepare itself according to the trend so that it is aware of the situation, as happened with most of the telecom companies when 4G was first implemented.
- As the telecom industry becomes more mature and the growth prospects become limited, it can look for expansion in overseas locations to boost its revenue further. Most of the emerging markets are located near India, so it will be easy for it to expand in the Asian region.
Market Sentiment
The surge of Vodafone Idea’s share price mirrors investor optimism and positive analyst ratings. It made a new 52-week high of ₹ 18.4, which reflects a significant gain of 196.49% from its 52-week low. The sectors like 5G and IoT position Vodafone Idea favourably despite a massive debt of ₹ 2,38,000 crores. Analyst ratings suggest the stock is undervalued by 49.5% at the current price of ₹ 16. These factors, combined with robust performance post-COVID-19 and increasing revenue per user, paint a good picture of the future profitability of the company. Investors need to conduct detailed research, considering factors like company fundamentals, industry trends, and financial health, to make informed investment decisions.


