Home / Mstc Ltd Jumps To All Time High 137 Up In Just 8 Months
MSTC Ltd. jumps to All-Time High: 137% up in Just 8+ Months!

Show Table of Contents
Table of Contents
- 1: Chart: MSTC All Time High & 52 Week Low as of 23 Dec 2023
- 2: MSTC Limited’s Record Surge to a New All-Time High
- 2.1: Factors Contributing to a Stock’s All-Time High
- 2.2: Positive Earnings Reports
- 2.3: Favorable Industry Trends
- 2.4: Positive Analyst Ratings
- 2.5: Potential Scenarios Following an All-Time High
- 3: MSTC Stock Analysis: Potential Supports and Targets
- 3.1: KEY PERFORMANCE METRICS
- 3.1.1: MSTC Fibonacci Retracement Or Support levels
- 3.1.2: MSTC Fibonacci Extensions Or Target levels
- 4: Making Informed Investment Decisions
- 4.1: Company’s Financial Health
- 4.2: Industry Outlook
- 4.3: Market Sentiment
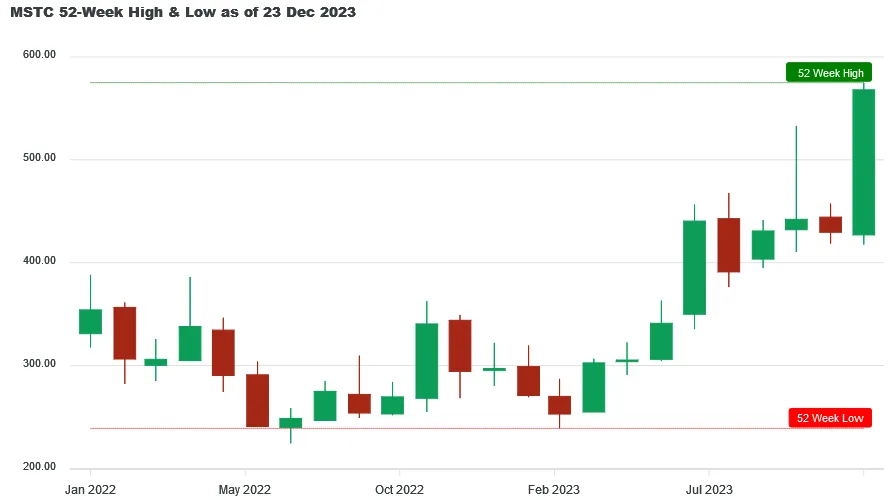
Chart: MSTC All Time High & 52 Week Low as of 23 Dec 2023

MSTC hit its 52 week low of ₹239.00 on 28 Mar 2023 and from there it move to ₹575.00 creating a brand-new All Time High on 22 Dec 2023, giving a whopping 137.66% return in just 8 months and 25 days.
If you had invested ₹10,000 at its 52-week low price, your investment would have grown to ₹23,766 by 23 Dec 2023. This represents a gain of ₹13,766 in just 8 months and 25 days. Given MSTCLTD's strong recent performance, Lets find out what opportunities lies ahead for MSTCLTD
If you had invested ₹10,000 at its 52-week low price, your investment would have grown to ₹23,766 by 23 Dec 2023. This represents a gain of ₹13,766 in just 8 months and 25 days. Given MSTCLTD's strong recent performance, Lets find out what opportunities lies ahead for MSTCLTD
Stay ahead of the market! Get instant alerts on crucial market breakouts. Don't miss out on key opportunities!
Your phone number will be HIDDEN to other users.
MSTC Limited’s Record Surge to a New All-Time High
The all-time high of MSTC Limited can be a result of many factors. Its previous all-time high was made on 20 December 2023 at ₹ 567.65. It took 02 days to create a new all-time high at ₹ 575 on 22 December 2023. In between, it made a low of ₹ 494.4 on 20 December 2023, implying a correction of over 12%. It may represent a change in the investors’ sentiment about the company due to improved financial condition or may represent overvaluation. Let’s go through the factors contributing to its all-time high.
Factors Contributing to a Stock’s All-Time High
Positive Earnings Reports
- In Q2 FY24, its revenue increased by 7.32% year-on-year, reaching ₹ 188 crores.
- Since 2019, it has continuously given dividends, and in 2022, the dividend yield of 5.93% was close to the interest paid by many banks. Its dividend payout ratio in 2021 and 2022 remained above 40%.
- In the last 5 years, its net margin has continuously increased, reaching 33.56% in 2022, which represents a net income of ₹ 242 crores.
Favorable Industry Trends
- Digital transformation has affected almost every business, including trade and auctions. Digital platforms have made it possible to become a part of the trade and auction process by sitting anywhere in the world. It includes e-auctions, e-procurement, etc., which are MSTC Limited’s work areas.
- E-commerce segment growth is not limited to B2C; it is also happening in the B2B segment. Industrial and agricultural commodities in whose trading MSTC is involved give immense growth potential to it.
- Global trade policies affect the dynamics of sourcing and supply of commodities on a global scale. It creates new opportunities and markets for MSTC to grow internationally.
Positive Analyst Ratings
According to Simple Wall Street, MSTC Limited’s price-to-earnings ratio of 17.4x is below the Indian market PE ratio of 29.3x. Returns provided by it exceeded those of the Indian market, which returned 28.4% over the past year. Based on the discounted cash flow model, its CMP of ₹ 568 is overvalued by 117.7% more than the fair value of the stock. On the contrary, according to the PE ratio of 17.4x, it is undervalued compared to its peers, with a peer average of 34.6x.
Potential Scenarios Following an All-Time High
(Based on the chart of 1-month timeframe)
Converting numbers and candles into information can provide us with the market’s stance on the stock, which may help us make correct investment decisions. Since the listing of MSTC Ltd. in March 2019, it has made 5 all-time highs after a gap of at least a month. The last all-time high was made in December 2023. In all the previous all-time highs under consideration, it always had a green candle with an upper shadow longer than the real body. A similar trend can be expected in the recent all-time high; thus, investors can expect a price correction till the real body becomes smaller than the upper shadow. On a daily basis, it is a highly volatile stock, so investors should place their stop loss accordingly.
MSTC Stock Analysis: Potential Supports and Targets
Fri 22 Dec 2023 - In a remarkable market development, MSTC has soared to ₹575.00, setting a brand-new All Time High record! With this surge, there are chances of it becoming volatile, as many investors may like to book their profits by exiting or closing their positions. At this time potential investors and current stakeholders should keep an eye for opportunities for entry or exit.
Below you will find MSTC's metrics highlight, potential support and targets derived using Fibonacci Retracement and Extensions method, where Golden Ratio is assumed to be a good support (entry point) and Golden Extension to be good resistance (target point)
KEY PERFORMANCE METRICS
| Metrics | Value | Occured On |
|---|---|---|
| Close Price | ₹568.00 | Sat, 23 Dec 2023 |
| 52 Week High | ₹575.00 | Fri, 22 Dec 2023 |
| 52 Week Low | ₹239.00 | Tue, 28 Mar 2023 |
| All Time High | ₹575.00 | Fri 22 Dec 2023 |
The above table shows that the close price of MSTC on Sat, 23 Dec 2023 was ₹568.00. Notably, the All-Time High is same as the 52-Week High, indicating that the all-time high was achieved recently and it cloud be a strong resistance level which would need great upward momentum to break.
It's possible that some investors might consider booking profits near the 575.00 mark, which could apply downward pressure on the stock price.
But what does this newly created milestone signify for potential investors? Lets find out.
MSTC Fibonacci Retracement Or Support levels
For those considering an entry, the Golden Ratio (61.8%) retracement level of ₹367 offers a promising point, given the likelihood of a pullback from these levels as new investors might come in at these levels.
| Retracement or Support Levels | Values | |
|---|---|---|
| S1 | 23.6% | ₹495 |
| S2 | 38.2% | ₹446 |
| S3 | 50.0% | ₹407 |
| S4 | 61.8% (Golden Ratio) | ₹367 |
| S5 | 78.6% | ₹310 |
| S6 | 52 Week Low | ₹239 |
Note: This table was last updated on Sat, 23 Dec 2023.
MSTC Fibonacci Extensions Or Target levels
For those considering an exit, the Golden Extension (161.8%) level of ₹782 offers a promising point, given the likelihood of a downward momentum from these levels as investors might start booking their profits at these levels.
| Extensions or Target Levels | Values | |
|---|---|---|
| T1 | 52 Week High | ₹575 |
| T2 | 138.2% | ₹703 |
| T3 | 161.8% (Golden Extension) | ₹782 |
| T4 | 200% | ₹911 |
| T5 | 261.8% | ₹1118 |
Note: This table was last updated on Sat, 23 Dec 2023.
Making Informed Investment Decisions
For any stock, reaching an all-time high is a significant milestone. Still, conducting thorough research and considering various factors is essential before making investment decisions. To make informed choices that align with your investment goals and risk tolerance, one needs to analyze the company’s fundamentals, industry trends, management’s strategy, and overall market conditions.
Company’s Financial Health
- In 2022, MSTC Limited had a debt of ₹ 145 crores covered by a free cash flow of ₹ 899 crores and cash & equivalents of ₹ 1601 crores. If the company doesn’t invest the excess funds for future growth, we may see an increased dividend payout ratio in FY24.
- In the short term, it has a liability of ₹ 1797 crores covered by assets of ₹ 2227 crores. The assets of ₹ 462 crores cover its long-term liabilities of ₹ 105 crores. Such a massive level of funds will help the company face any adverse financial situation in the future.
Industry Outlook
- Environmental sustainability and recycling have become a topic of concern for the existence of humanity. It has shifted the global opinion of growth at any cost to growth with the sustainability of the environment. The work of recycling and scrap management industries aligns with this trend.
- As more countries become technologically advanced, the demand for electronics, automotive, etc., will grow; thus, the demand for various metals and minerals will also increase. It will benefit the companies involved in the trading of these commodities.
Market Sentiment
MSTC Limited’s record surge to an all-time high of ₹ 575 reflects strong market confidence based on robust financial performance and favourable industry trends. Analysts suggest undervaluation on the basis of market averages. If it doesn’t invest its excess funds for future growth, then we may see an increased dividend amount being paid to the shareholders. The stock’s volatility has shown price correction patterns after reaching all-time highs, suggesting cautious investment strategies. Investors need to conduct detailed research, considering factors like company fundamentals, industry trends, and financial health, to make informed investment decisions.


