Home / Cochin Shipyard Soars To All Time High Grows 234 In Under 9 Mths
Cochin Shipyard Soars to All-Time High, Grows 234% in Under 9 Mths

Show Table of Contents
Table of Contents
- 1: Chart: Cochin Shipyard All Time High & 52 Week Low as of 26 Dec 2023
- 2: Cochin Shipyard’s Record Surge to a New All-Time High
- 2.1: Factors Contributing to a Stock’s All-Time High
- 2.2: Positive Earnings Reports
- 2.3: Favorable Industry Trends
- 2.4: Positive Analyst Ratings
- 2.5: Potential Scenarios Following an All-Time High
- 3: Cochin Shipyard Stock Analysis: Potential Supports and Targets
- 3.1: KEY PERFORMANCE METRICS
- 3.1.1: Cochin Shipyard Fibonacci Retracement Or Support levels
- 3.1.2: Cochin Shipyard Fibonacci Extensions Or Target levels
- 4: Making Informed Investment Decisions
- 4.1: Company’s Financial Health
- 4.2: Industry Outlook
- 4.3: Market Sentiment
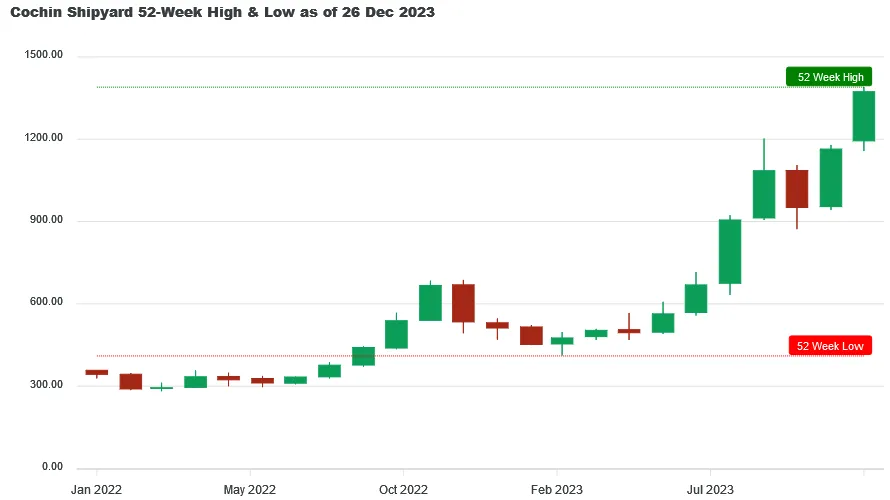
Chart: Cochin Shipyard All Time High & 52 Week Low as of 26 Dec 2023

Cochin Shipyard hit its 52 week low of ₹410.40 on 27 Mar 2023 and from there it move to ₹1390.00 creating a brand-new All Time High on 26 Dec 2023, giving a whopping 234.60% return in just 8 months and 29 days.
If you had invested ₹10,000 at its 52-week low price, your investment would have grown to ₹33,460 by 26 Dec 2023. This represents a gain of ₹23,460 in just 8 months and 29 days. Given COCHINSHIP's strong recent performance, Lets find out what opportunities lies ahead for COCHINSHIP
If you had invested ₹10,000 at its 52-week low price, your investment would have grown to ₹33,460 by 26 Dec 2023. This represents a gain of ₹23,460 in just 8 months and 29 days. Given COCHINSHIP's strong recent performance, Lets find out what opportunities lies ahead for COCHINSHIP
Stay ahead of the market! Get instant alerts on crucial market breakouts. Don't miss out on key opportunities!
Your phone number will be HIDDEN to other users.
Cochin Shipyard’s Record Surge to a New All-Time High
The all-time high of Cochin Shipyard can be a result of many factors. Its previous all-time high was made on 19 December 2023 at ₹ 1337.45. It took 07 days to create a new all-time high at ₹ 1390 on 26 December 2023. In between, it made a low of ₹ 1200 on 20 December 2023, implying a correction of over 10%. It may represent a change in the investors’ sentiment about the company due to improved financial condition or may represent overvaluation. Let’s go through the factors contributing to its all-time high.
Factors Contributing to a Stock’s All-Time High
Positive Earnings Reports
- Compared to the previous quarter, its revenue has almost doubled in Q3 ’23 on account of comparatively lower operating expenses. It earned ₹182 crores as net income, an increase of 84.58% quarter-on-quarter.
- Cochin Shipyard’s revenue increased by 48.09% and reached ₹ 1012 crores. On comparing it with net income, it converts to over 18% of revenue, which is a significant number.
- Its dividend payout ratio has continuously increased. In 2022, the payout ratio reached a record 73.39%. Based on its high level of reserve funds, we may see the trend continuing in the future.
Favorable Industry Trends
- The Indian government’s spending on maintaining its naval fleet has continuously increased. More focus is being given to fulfilling the defense requirement through Indian companies instead of purchasing them from foreign countries. Cochin Shipyard has already started to gain a significant share of it through various defense contracts under its name.
- Cochin Shipyard is also benefiting by getting involved in the research & development of the next-gen missile vessels for India. It has significantly enhanced its portfolio, which was mostly focused on the maintenance of ships.
- Cochin Shipyard has already made its name in India, and now it can expand its business internationally to make India a central point on the world map for defense purchases and commercial ships.
Positive Analyst Ratings
According to Geojit BNP Paribas, the Cochin Shipyards stock is a good share to accumulate. The research house has provided the opinion based on a 12-month investment period with a target price of ₹ 1265. Cochin Shipyards got this rating based on strong performance, healthy order backlog, capacity expansion nearing completion, etc. Its current order backlog is nearly ₹ 2200 crores, whose results will be seen during the next 2-3 years. Once the new facility starts functioning, its operational capacity will increase by 100%.
Potential Scenarios Following an All-Time High
(Based on the chart of 1-month timeframe)
Converting numbers and candles into information can provide us with the market’s stance on the stock, which may help us make correct investment decisions. We have limited our study to all-time highs made after a gap of at least a month. Since the listing of Cochin Shipyards Limited in August 2017, it has made all-time highs only three times, so it becomes difficult to predict future action due to a lack of data. An interesting trend can be seen on the price chart between March 2023 and September 2023. It has continuously made higher highs and higher lows, with new all-time highs made in July, August and September. There was a weakness in trend in October, but with the formation of a new all-time high in December, we can expect the upward movement to continue.
Cochin Shipyard Stock Analysis: Potential Supports and Targets
Tue 26 Dec 2023 - In a remarkable market development, Cochin Shipyard has soared to ₹1390.00, setting a brand-new All Time High record! With this surge, there are chances of it becoming volatile, as many investors may like to book their profits by exiting or closing their positions. At this time potential investors and current stakeholders should keep an eye for opportunities for entry or exit.
Below you will find Cochin Shipyard's metrics highlight, potential support and targets derived using Fibonacci Retracement and Extensions method, where Golden Ratio is assumed to be a good support (entry point) and Golden Extension to be good resistance (target point)
KEY PERFORMANCE METRICS
| Metrics | Value | Occured On |
|---|---|---|
| Close Price | ₹1373.20 | Tue, 26 Dec 2023 |
| 52 Week High | ₹1390.00 | Tue, 26 Dec 2023 |
| 52 Week Low | ₹410.40 | Mon, 27 Mar 2023 |
| All Time High | ₹1390.00 | Tue 26 Dec 2023 |
The above table shows that the close price of Cochin Shipyard on Tue, 26 Dec 2023 was ₹1373.20. Notably, the All-Time High is same as the 52-Week High, indicating that the all-time high was achieved recently and it cloud be a strong resistance level which would need great upward momentum to break.
It's possible that some investors might consider booking profits near the 1390.00 mark, which could apply downward pressure on the stock price.
But what does this newly created milestone signify for potential investors? Lets find out.
Cochin Shipyard Fibonacci Retracement Or Support levels
For those considering an entry, the Golden Ratio (61.8%) retracement level of ₹784 offers a promising point, given the likelihood of a pullback from these levels as new investors might come in at these levels.
| Retracement or Support Levels | Values | |
|---|---|---|
| S1 | 23.6% | ₹1158 |
| S2 | 38.2% | ₹1015 |
| S3 | 50.0% | ₹900 |
| S4 | 61.8% (Golden Ratio) | ₹784 |
| S5 | 78.6% | ₹620 |
| S6 | 52 Week Low | ₹410 |
Note: This table was last updated on Tue, 26 Dec 2023.
Cochin Shipyard Fibonacci Extensions Or Target levels
For those considering an exit, the Golden Extension (161.8%) level of ₹1995 offers a promising point, given the likelihood of a downward momentum from these levels as investors might start booking their profits at these levels.
| Extensions or Target Levels | Values | |
|---|---|---|
| T1 | 52 Week High | ₹1390 |
| T2 | 138.2% | ₹1764 |
| T3 | 161.8% (Golden Extension) | ₹1995 |
| T4 | 200% | ₹2369 |
| T5 | 261.8% | ₹2974 |
Note: This table was last updated on Tue, 26 Dec 2023.
Making Informed Investment Decisions
For any stock, reaching an all-time high is a significant milestone. Still, conducting thorough research and considering various factors is essential before making investment decisions. To make informed choices that align with your investment goals and risk tolerance, one needs to analyze the company’s fundamentals, industry trends, management’s strategy, and overall market conditions.
Company’s Financial Health
- In 2022, Cochin Shipyard had a debt of ₹ 587 crores covered by a free cash flow of ₹ 1637 crores and cash & equivalents of ₹ 3284 crores. The debt has shown a marginal increase of 6.53%, whereas the free cash flow and cash & equivalent increased by 36.98% and 109.43%, respectively.
- In the short term, it has a liability of ₹ 5121 crores covered by assets of ₹ 7137 crores. The assets of ₹ 2915 crores cover its long-term liabilities of ₹ 501 crores. As it has funds in excess under free cash flow and cash & equivalent, we may see an increase in assets or an increased dividend payout.
Industry Outlook
- As Indian shipyards are still not properly equipped to handle the largest and most advanced sea vessels, we may see increased spending on the upgrade and expansion of shipyards. Indian Shipyards have an advantage in the Indian Ocean due to its strategic geographical position and economic stability of the country.
- As India starts to focus on Indian-made defense products and starts its export, we may see an increase in the order books of companies involved in such projects. It can also result in strategic partnerships among the Indian and Foreign countries to strengthen the “Make in India” initiative.
Market Sentiment
Cochin Shipyards Limited has almost tripled the investment of its investors since its listing and created a new all-time high of ₹ 1390 in December 2023. An impressive quarter-on-quarter net income increase and a substantial revenue rise drove the bull rally. The favourable industry trends will continue to remain for many years as the projects in which the company is involved require long-time commitment from both parties, especially in the case of defense contracts. The Analyst’s accumulated rating means that even though the share price is high, it still has a lot of potential for further growth with modest expectations. Investors need to conduct detailed research, considering factors like company fundamentals, industry trends, and financial health, to make informed investment decisions.


