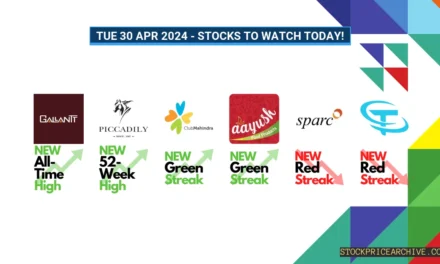



Shalby Share Price History and Returns 2018 to 2026
|
Shalby Limited |
|||

|
Price: ₹170.62 (1%) | ||
| 52 Week Low: ₹125.82 52 Week High: ₹274.70 |
|||
| Market Capital: 1,669.53 Crore (Small-cap) | |||
| Healthcare -> Medical Care Facilities | |||
Show Table of Contents
Table of Contents
- 1: Shalby Stock Highlights
- 1.1: 52-Week High Low
- 1.2: All Time High
- 2: Shalby Recent Performance
- 3: Shalby Stock Price Chart From 2017 to 2026
- 4: Shalby Stock Price History Table From 2017 to 2026
- 5: Analyzing the Impact of Investing in Shalby
- 5.1: Shalby Stock Returns In Last 5 Years
- 6: Shalby Returns vs Bank FD Returns
Shalby Stock Highlights
As of 15 Jun 2026, Shalby Stock price is ₹170.62 which is ₹104.08 below 52-week high of ₹274.70 and ₹44.80 above 52-week low of ₹125.82
52-Week High Low
- Shalby 52-Week High is ₹274.70 occurred on 22 Sep 2025
- Shalby 52-Week Low is ₹125.82 occurred on 30 Mar 2026
All Time High
- The all-time high or the highest price that Shalby stocks have ever touched was ₹339.50 and this occurred on Jan 2024.
- The highest closing price at which Shalby stocks have ever closed was ₹306.44 recorded on Jan 2024.
Stay ahead of the market! Get instant alerts on crucial market breakouts. Don't miss out on key opportunities!
Your phone number will be HIDDEN to other users.
Shalby Recent Performance
Over the past 15 trading days, the value of Shalby's stock has decreased by ₹3.32 (-1.91%). On 26 May 2026, its one share was worth ₹173.94 and by 15 Jun 2026, the value dropped to ₹170.62. During this period it created a highest high of ₹182.27 and lowest low of ₹162.03.
Click on legend items to show/hide respective price lines
Shalby Stock Price Chart From 2017 to 2026
Click on legend items to show/hide respective price lines
Shalby Stock Price History Table From 2017 to 2026
| Year | Shalby | YOY Chg% | ↑High - ↓Low |
|---|---|---|---|
| 2026 | ₹168.93 | -17.2% |
↑ ₹207.00 ↓ ₹125.00 |
| 2025 | ₹203.93 | -11.2% |
↑ ₹274.00 ↓ ₹177.00 |
| 2024 | ₹229.65 | -24.2% |
↑ ₹339.00 ↓ ₹204.00 |
| 2023 | ₹302.60 | 100.7% |
↑ ₹329.00 ↓ ₹115.00 |
| 2022 | ₹150.75 | 6.9% |
↑ ₹157.00 ↓ ₹94.95 |
| 2021 | ₹140.95 | 29.7% |
↑ ₹214.00 ↓ ₹96.10 |
| 2020 | ₹108.65 | 17.2% |
↑ ₹121.00 ↓ ₹40.10 |
| 2019 | ₹92.70 | -36.6% |
↑ ₹149.00 ↓ ₹75.25 |
| 2018 | ₹146.05 | -32.2% |
↑ ₹274.00 ↓ ₹130.00 |
| 2017 | ₹215.25 | - |
↑ ₹254.00 ↓ ₹209.00 |
Analyzing the Impact of Investing in Shalby
Shalby Stock price in the year 2017 was ₹215.25. If you had invested ₹10,000 in Shalby Stock in 2017, in 9 years, your investment would have reduced to ₹7,848 by the end of 2026. This represents a negative return of -21.6% from 2017 to 2026, with a compound annual growth rate (CAGR) of -2.7%.
Shalby Stock Returns In Last 5 Years
- Its highest stock price in the last 5 years was: ₹339.50 and lowest was: ₹94.95
- Shalby Stock price in 2021 was ₹140.95
- By 2026, its stock price rose to ₹168.93
- It gave a positive return of over 19.9% with a CAGR of 3.7% over the last 5 years
- If you had invested ₹10,000 in Shalby in 2021 then in 5 years, your investment would have grown to ₹11,985.1 by 2026, which is 1.20 times of your initial investment.
Shalby Returns vs Bank FD Returns
| Investment Type | Initial Amount | Final Value | Total Returns |
|---|---|---|---|
| Shalby Shares | ₹10,000 | ₹7,848.08 | -21.5% |
| Bank FD (Simple Interest) | ₹10,000 | ₹15,400 | 54.0% |
| Bank FD (Compound Interest) | ₹10,000 | ₹16,894.78 | 68.9% |
Disclaimer: The information provided on this page is for educational purposes only and should not be considered as financial advice. Historical performance data and technical analysis cannot guarantee future results. Stock investments are subject to market risks. Please consult with a qualified financial advisor before making any investment decisions.
All stock data shown is sourced from publicly available information and while we strive for accuracy, we cannot guarantee the absolute accuracy of all figures. Users should verify critical information from official sources before making investment decisions.