Home / Repro India Reaches All Time High Jumps 171 In Just 8 Months
Repro India Reaches all-time high: Jumps 171% in just 8+ Months!

Show Table of Contents
Table of Contents
- 1: Chart: Repro India All Time High & 52 Week Low as of 20 Dec 2023
- 2: Repro India’s Record Surge to a New All-Time High
- 2.1: Factors Contributing to a Stock’s All-Time High
- 2.2: Positive Earnings Reports
- 2.3: Favorable Industry Trends
- 2.4: Analyst Ratings
- 3: Potential Scenarios Following an All-Time High
- 4: Repro India Stock Analysis: Potential Supports and Targets
- 4.1: KEY PERFORMANCE METRICS
- 4.1.1: Repro India Fibonacci Retracement Or Support levels
- 4.1.2: Repro India Fibonacci Extensions Or Target levels
- 5: Making Informed Investment Decisions
- 5.1: Company’s Financial Health
- 5.2: Industry Outlook
- 5.3: Market Sentiment
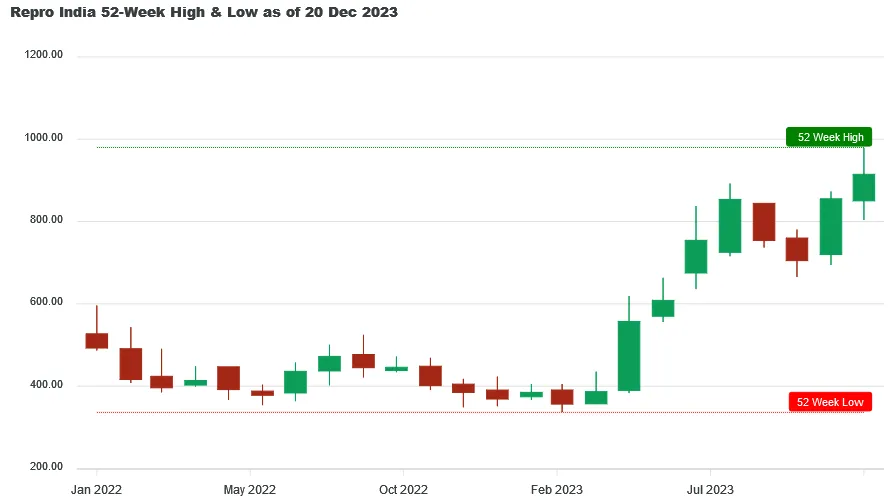
Chart: Repro India All Time High & 52 Week Low as of 20 Dec 2023

Repro India hit its 52 week low of ₹336.60 on 28 Mar 2023 and from there it move to ₹980.00 creating a brand-new All Time High on 20 Dec 2023, giving a whopping 171.76% return in just 8 months and 22 days.
If you had invested ₹10,000 at its 52-week low price, your investment would have grown to ₹27,176 by 20 Dec 2023. This represents a gain of ₹17,176 in just 8 months and 22 days. Given REPRO's strong recent performance, Lets find out what opportunities lies ahead for REPRO
If you had invested ₹10,000 at its 52-week low price, your investment would have grown to ₹27,176 by 20 Dec 2023. This represents a gain of ₹17,176 in just 8 months and 22 days. Given REPRO's strong recent performance, Lets find out what opportunities lies ahead for REPRO
Stay ahead of the market! Get instant alerts on crucial market breakouts. Don't miss out on key opportunities!
Your phone number will be HIDDEN to other users.
Repro India’s Record Surge to a New All-Time High
The all-time high of Repro India can be a result of many factors. Its previous all-time high was made on 22 August 2023 at ₹ 892.8. It took three months and 28 days to create a new all-time high at ₹ 980 on 20 December 2023. In between, it made a low of ₹ 665.05 on 19 October 2023, implying a correction of over 25%. It may represent a change in the investors’ sentiment about the company due to improved financial condition or may represent overvaluation. Let’s go through the factors contributing to its all-time high.
Factors Contributing to a Stock’s All-Time High
Positive Earnings Reports
- In the last 7 quarters, it has continuously provided double-digit revenue growth year-on-year. In Q2 FY24, its revenue increased by 29.35% YOY and reached ₹ 117 crores.
- In Q1 FY24 and Q2 FY24, Repro India’s net income increased by 1688.24% and 343.18%, YOY, respectively. The increase in net income in the recent quarter was due to lower operating expenses and comparatively lower losses under the non-operating income tab.
- In 2022, after a gap of 2 years, its profit margin has again become positive. In 2022, its net margin was 2.07%.
Favorable Industry Trends
- With the advancement of technology, customers have become more sensitive towards the final print’s quality. More importance is given to repro, anilox and design to achieve the desired quality output. Repro India can use this trend to its advantage to create a customer base focusing on high-quality products.
- As people have become more accustomed to creating detailed and attractive designs over systems, the popularity of digital printing, which differs from conventional printing methods, has increased. It is being used for shorter runs and personalized products. Repro India, through its cutting-edge technology, can easily position itself as a trustworthy digital printer.
- Flexography has given a new edge to conventional, less attractive prints. It has made it possible to create unique textures and 3D effects to attract customers. Companies like Repro India are poised to gain from the technological advancement in flexography.
Analyst Ratings
According to Simple Wall Street, Repro India is 1,25,831% overvalued based on the discounted cash flow model. Repro has high-quality earnings, and it has become profitable in the past. Its debt-to-equity ratio has reduced from 44.8% to 1.8% over the past 5 years. With a PE ratio of 99.8x, it is overvalued compared to its peers, with an average PE of 36x.
Potential Scenarios Following an All-Time High
(Based on the chart of 1-month & 1-day timeframe)
Converting numbers and candles into information can provide us with the market’s stance on the stock, which may help us make correct investment decisions. On a monthly time frame, it has formed an all-time high 7 times since its month of listing, i.e., December 2005. Due to the data of all-time highs being spread too much, we will focus our observations based on 52-week highs made since January 2020. Most of the time, when it has made a new 52-week high with a bearish candle with less volume, it may indicate that the investors are ready to book profits at a lower valuation. A similar trend was seen during the all-time high on 20 December 2023. We can expect a significant correction happening in the future.
Repro India Stock Analysis: Potential Supports and Targets
Wed 20 Dec 2023 - In a remarkable market development, Repro India has soared to ₹980.00, setting a brand-new All Time High record! With this surge, there are chances of it becoming volatile, as many investors may like to book their profits by exiting or closing their positions. At this time potential investors and current stakeholders should keep an eye for opportunities for entry or exit.
Below you will find Repro India's metrics highlight, potential support and targets derived using Fibonacci Retracement and Extensions method, where Golden Ratio is assumed to be a good support (entry point) and Golden Extension to be good resistance (target point)
KEY PERFORMANCE METRICS
| Metrics | Value | Occured On |
|---|---|---|
| Close Price | ₹914.75 | Wed, 20 Dec 2023 |
| 52 Week High | ₹980.00 | Wed, 20 Dec 2023 |
| 52 Week Low | ₹336.60 | Tue, 28 Mar 2023 |
| All Time High | ₹980.00 | Wed 20 Dec 2023 |
The above table shows that the close price of Repro India on Wed, 20 Dec 2023 was ₹914.75. Notably, the All-Time High is same as the 52-Week High, indicating that the all-time high was achieved recently and it cloud be a strong resistance level which would need great upward momentum to break.
It's possible that some investors might consider booking profits near the 980.00 mark, which could apply downward pressure on the stock price.
But what does this newly created milestone signify for potential investors? Lets find out.
Repro India Fibonacci Retracement Or Support levels
For those considering an entry, the Golden Ratio (61.8%) retracement level of ₹582 offers a promising point, given the likelihood of a pullback from these levels as new investors might come in at these levels.
| Retracement or Support Levels | Values | |
|---|---|---|
| S1 | 23.6% | ₹828 |
| S2 | 38.2% | ₹734 |
| S3 | 50.0% | ₹658 |
| S4 | 61.8% (Golden Ratio) | ₹582 |
| S5 | 78.6% | ₹474 |
| S6 | 52 Week Low | ₹336 |
Note: This table was last updated on Wed, 20 Dec 2023.
Repro India Fibonacci Extensions Or Target levels
For those considering an exit, the Golden Extension (161.8%) level of ₹1377 offers a promising point, given the likelihood of a downward momentum from these levels as investors might start booking their profits at these levels.
| Extensions or Target Levels | Values | |
|---|---|---|
| T1 | 52 Week High | ₹980 |
| T2 | 138.2% | ₹1225 |
| T3 | 161.8% (Golden Extension) | ₹1377 |
| T4 | 200% | ₹1623 |
| T5 | 261.8% | ₹2021 |
Note: This table was last updated on Wed, 20 Dec 2023.
Making Informed Investment Decisions
For any stock, reaching an all-time high is a significant milestone. Still, conducting thorough research and considering various factors is essential before making investment decisions. To make informed choices that align with your investment goals and risk tolerance, one needs to analyze the company’s fundamentals, industry trends, management’s strategy, and overall market conditions.
Company’s Financial Health
- In FY23, Repro India had a debt of ₹ 96.20 crores with a negative free cash flow of ₹ 5.31 crores and cash & equivalents of ₹ 15.80 crores. It shows a huge difference between the debt and funds available, which may make the company sell a few of its assets to bolster its funds at hand.
- In the short term, it has a liability of ₹ 104 crores covered by assets of ₹ 159 crores. The assets of ₹ 305 crores cover its long-term liabilities of ₹ 63.71 crores.
Industry Outlook
- In flexography, anilox engraving techniques will become more advanced, making the ink transfer process more efficient and creating persistent colours.
- Research in colour printing is becoming more intense with the introduction of new chemicals and technologies. Pantone colours have a variety of uses, and for that purpose, exploration of the use of 4-colour printing to create a wide range of Pantone colours is being done.
- The evolution of the flexo ecosystem industry can see high integrity in future to maintain high standards and address challenges effectively.
Market Sentiment
Repro India has reached an all-time high due to a strong industry outlook in flexography & digital printing, which is further boosted by positive earnings reports with significant revenue & net income growth. The company has a unique advantage due to technological advances, high-quality product demand, expanding digital printing market, etc. Still, the overvalued tag given to the stock by the analysts may indicate a possibility for future correction. On the debt and cash flow front, it needs strategic financial management. Investors need to conduct detailed research, considering factors like company fundamentals, industry trends, and financial health, to make informed investment decisions.


