Home / Anant Raj Global Soars From 52 Week Low Gains 326 In Just 9 Months
Anant Raj Global Soars from 52-Week Low, Gains 326% in Just 9 Months!

Show Table of Contents
Table of Contents
- 1: Chart: Anant Raj Global 52 Week High & 52 Week Low as of 08 Jan 2024
- 2: Anant Raj Global’s Record Surge to a New All-Time High
- 2.1: Factors Contributing to a Stock’s All-Time High
- 2.2: Positive Earnings Reports
- 2.3: Favorable Industry Trends
- 2.4: Analyst Ratings
- 2.5: Potential Scenarios Following an All-Time High
- 3: Anant Raj Global Stock Analysis: Potential Supports and Targets
- 3.1: KEY PERFORMANCE METRICS
- 3.1.1: Anant Raj Global Fibonacci Retracement Or Support levels
- 3.1.2: Anant Raj Global Fibonacci Extensions Or Target levels
- 4: Making Informed Investment Decisions
- 4.1: Company’s Financial Health
- 4.2: Industry Outlook
- 4.3: Market Sentiment
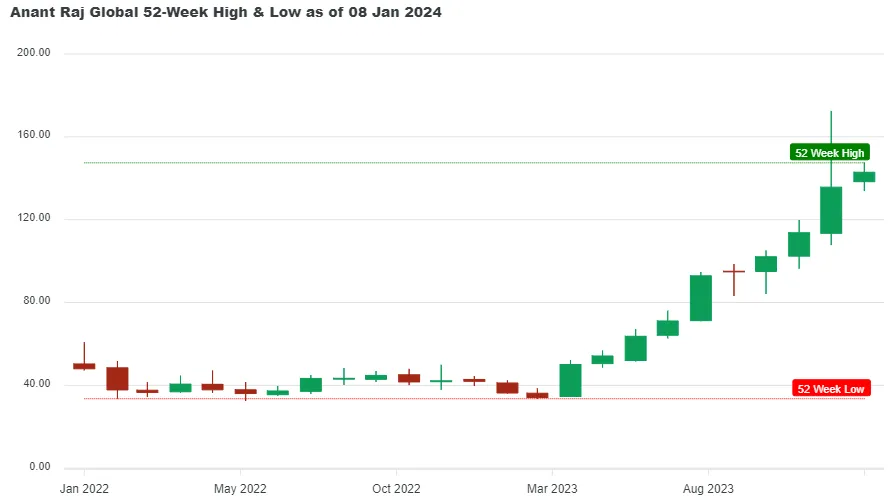
Chart: Anant Raj Global 52 Week High & 52 Week Low as of 08 Jan 2024

Anant Raj Global hit its 52 week low of ₹33.55 on 27 Mar 2023 and from there it move to ₹147.45 creating a brand-new 52 Week High on 08 Jan 2024, giving a whopping 325.93% return in just 9 months and 12 days.
If you had invested ₹10,000 at its 52-week low price, your investment would have grown to ₹42,593 by 08 Jan 2024. This represents a gain of ₹32,593 in just 9 months and 12 days. Given TARC's strong recent performance, Lets find out what opportunities lies ahead for TARC
If you had invested ₹10,000 at its 52-week low price, your investment would have grown to ₹42,593 by 08 Jan 2024. This represents a gain of ₹32,593 in just 9 months and 12 days. Given TARC's strong recent performance, Lets find out what opportunities lies ahead for TARC
Stay ahead of the market! Get instant alerts on crucial market breakouts. Don't miss out on key opportunities!
Your phone number will be HIDDEN to other users.
Anant Raj Global’s Record Surge to a New All-Time High
The all-time high of Anant Raj Global can be a result of many factors. Its previous all-time high was made on 20 December 2023 at ₹ 145. It took 19 days to create a new all-time high at ₹ 147.45 on 08 January 2023. In between, it made a low of ₹ 126.3 on 20 December 2023, implying a correction of over 12%. It may represent a change in the investors’ sentiment about the company due to improved financial condition or may represent overvaluation. Let’s go through the factors contributing to its all-time high.Factors Contributing to a Stock’s All-Time High
Positive Earnings Reports
- In FY23, its revenue increased by 47.03%. The total revenue reached ₹ 372 crores.
- In Q2 FY24, the losses under the non-operating income have reduced by 6.64% year-on-year. It suffered a loss of ₹ 25.2 crores in the mentioned quarter.
- In 2022, its net margin increased to 5.46%, which resulted in a net income of ₹ 20.34 crores.
Favorable Industry Trends
- The new housing supply is continuously increasing, as owning a home is a dream of almost every Indian family. At a time when, due to inflation, the interest rates of almost every country are increasing, India has kept its interest rates almost similar. Anant Raj Global can take advantage of it by selling as many units at the time of lower interest rates before it starts to align with the global trends.
- Every business has risks involved in their respective industries. To reduce such risks, the companies focus on diversifying their business. Anant Raj Global’s (TARC) portfolio includes IT parks, independent floors, plots, hospitality projects, etc., which have diversified its risk in the real estate industry.
- People’s disposable income is increasing, and their aspirations concerning the design of homes and the amenities provided are also increasing. Anant Raj Global can focus on this high volume and low price segment to boost its revenue further and make a name amongst the home buyers in the particular category.
Analyst Ratings
According to Simply Wall Street, based on the discounted cash flow model, the fair price of Anant Raj Global (TARC) is ₹ 5.98, whereas its current price is ₹ 142.9. It means that the stock is 2289.9% overvalued. TARC is a good value stock based on its price-to-sales ratio of 12x compared to the peer average of 12.5x. Historically, investors have been ready to pay more for the stock on a comparison based on price-to-sales. It fails in the test for being in a good financial position as the interest payments are not well covered by earnings.Potential Scenarios Following an All-Time High
Converting numbers and candles into information can provide us with the market’s stance on the stock, which may help us make correct investment decisions. Since the listing of Anant Raj Global Limited (TARC) in December 2020, it has converted an investment of ₹ 21 into ₹ 149.1, which means it gave 7.1x returns in around 3 years. In April 2023, it started its bull rally with higher highs and higher lows every month. We can expect the trends to continue so the investors may enter the stock at the price of their liking but keep the stop loss at the low made in the previous month.Anant Raj Global Stock Analysis: Potential Supports and Targets
As Anant Raj Global today (Mon 08 Jan 2024) created a new 52 week high there are chances of it becoming volatile. At this time potential investors and investors should keep an eye for opportunities for entry or exit. Below you will find Anant Raj Global's metrics highlight, potential support and targets derived using Fibonacci Retracement and Extensions method, where Golden Ratio is assumed to be a good support (entry point) and Golden Extension to be good resistance (target point)
KEY PERFORMANCE METRICS
| Metrics | Value | Occured On |
|---|---|---|
| Close Price | ₹142.90 | Mon, 08 Jan 2024 |
| 52 Week High | ₹147.45 | Mon, 08 Jan 2024 |
| 52 Week Low | ₹33.55 | Mon, 27 Mar 2023 |
| All Time High | ₹172.50 | Fri 08 Dec 2023 |
The above table shows that the close price of Anant Raj Global on Mon, 08 Jan 2024 was ₹142.90. The next target for it could be the All-Time High of ₹172.50 which is ₹29.6 more than from its close price of ₹142.90.
It's possible that some investors might consider booking profits near the 147.45 mark, which could apply downward pressure on the stock price.
But what does this newly created milestone signify for potential investors? Lets find out.
Anant Raj Global Fibonacci Retracement Or Support levels
For those considering an entry, the Golden Ratio (61.8%) retracement level of ₹77 offers a promising point, given the likelihood of a pullback from these levels as new investors might come in at these levels.
| Retracement or Support Levels | Values | |
|---|---|---|
| S1 | 23.6% | ₹120 |
| S2 | 38.2% | ₹103 |
| S3 | 50.0% | ₹90 |
| S4 | 61.8% (Golden Ratio) | ₹77 |
| S5 | 78.6% | ₹57 |
| S6 | 52 Week Low | ₹33 |
Note: This table was last updated on Mon, 08 Jan 2024.
Anant Raj Global Fibonacci Extensions Or Target levels
For those considering an exit, the Golden Extension (161.8%) level of ₹217 offers a promising point, given the likelihood of a downward momentum from these levels as investors might start booking their profits at these levels.
| Extensions or Target Levels | Values | |
|---|---|---|
| T1 | 52 Week High | ₹147 |
| T2 | 138.2% | ₹190 |
| T3 | 161.8% (Golden Extension) | ₹217 |
| T4 | 200% | ₹261 |
| T5 | 261.8% | ₹331 |
Note: This table was last updated on Mon, 08 Jan 2024.
Also read: Anant Raj Global Long Term Share Price Target From 2025 to 2039
Making Informed Investment Decisions
For any stock, reaching an all-time high is a significant milestone. Still, conducting thorough research and considering various factors is essential before making investment decisions. To make informed choices that align with your investment goals and risk tolerance, one needs to analyze the company’s fundamentals, industry trends, management’s strategy, and overall market conditions.Company’s Financial Health
- In FY23, Anant Raj Global had a debt of ₹ 1386 crores with a negative free cash flow of ₹ 194 crores and cash & equivalents of ₹ 115 crores. It shows a huge difference between the debt and funds, which makes it essential for the company to increase the amount under free cash flow or cash & equivalents.
- In Q2 FY24, it had total liabilities of ₹ 1888 crores covered by the assets of ₹ 3248 crores. It may need to sell a few of its assets to improve its free cash flow and be better positioned to handle adverse financial situations that may arise in the future.
Industry Outlook
- As India grows and moves to a $ 5 trillion economy, the spread of the population to Tier-II & III cities will increase. It will provide an opportunity for real estate developers who have already proved their worth in delivering big projects in Tier-I cities and nearby areas to expand in new areas.
- As people’s disposable income and the number of nuclear families increase, the demand for apartments will increase. It is also possible that if the real estate prices go beyond the reach of most people in areas near high business activity, big players may enter the market in the form of make-rent-manage businesses.


