Home / Tue 23 Apr 2024 Stocks To Watch
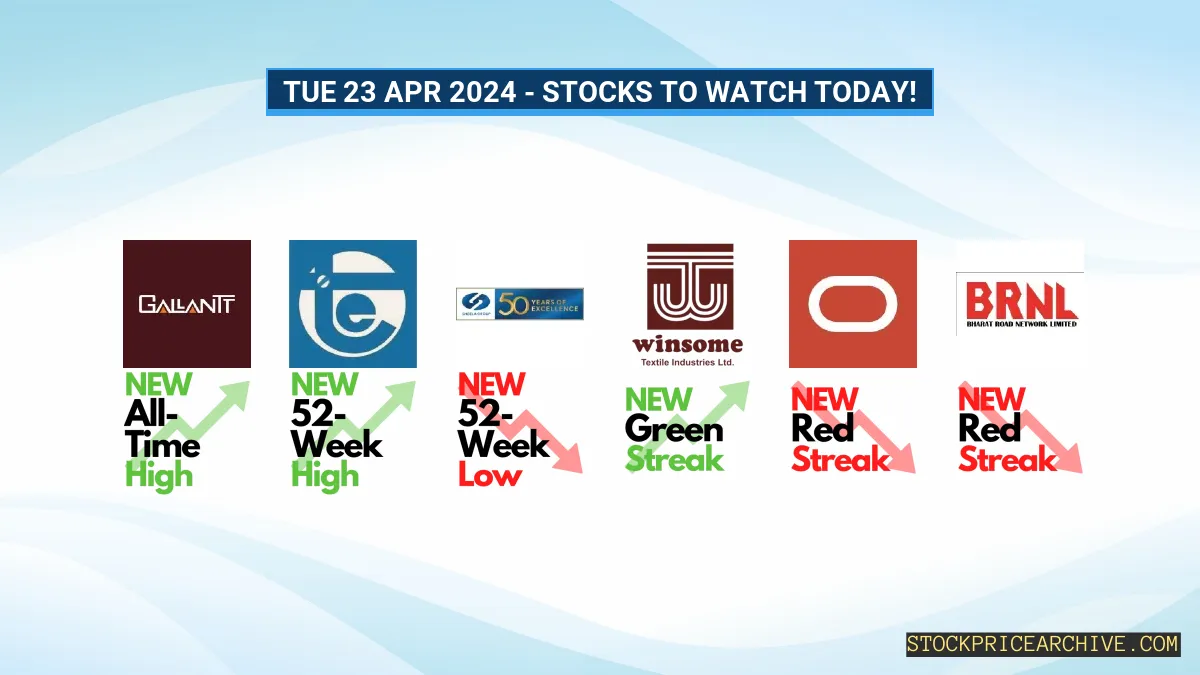
Stocks To Watch Today (23 Apr 2024): Gallantt Metal Hits New All-Time High, TECHNOE Brews 52-Week High & More

Show Table of Contents
Table of Contents
Stocks To Watch for Today!
We have identified some stocks that have potential to give big moves today.
| Company | Yesterday Close | Current Trend |
|---|---|---|
| Gallantt Metal | 263.14 (+4.98%) | Bullish: 7 Day Green Streak, Created New All-Time High |
| TECHNOE | 967.54 (+4.86%) | Bullish: 5 Day Green Streak, Created New 52-Week High |
| Sheela Foam | 912.50 (-2.32%) | Bearish: 1 Day Red Streak, Creates New 52-Week Low |
| Winsome Yarns | 3.65 (+1.38%) | Bullish: 14 Day Green Streak (Small Cap Stock) |
| Oracle Financial Services Software | 7538.50 (-0.85%) | Bearish: 11 Day Red Streak |
| Bharat Road Network | 57.95 (-1.95%) | Bearish: 9 Day Red Streak (Small Cap Stock) |
Intrigued by our stock picks? Get ready to discover the fascinating trends that sealed the deal for their inclusion!
➲ Gallantt Metal (Bullish Pattern)
- Gallantt Metal has made a record in the recent trading session by hitting a new All-Time-High (ATH) of ₹263.14, surpassing its previous ATH of ₹250.64 set just 3 days prior. This surge highlights the strong momentum and bullish sentiment surrounding Gallantt Metal.
- Performance Overview: In the past 22 trading sessions, Gallantt Metal has closed in the green 16 times, resulting in a win rate of 72.72%.
- Recent Trend: Gallantt Metal has been on a 7-day winning streak since Tue 09 Apr 2024, driving its price from ₹199.14 to ₹263.14, marking an impressive 32.13% gain.
- Returns: Over the 22 trading sessions, Gallantt Metal has delivered a return of 39.15%, turning a ₹10,000 investment into ₹13,915.
- Financial Insight: Gallantt Metal’s 2023-Q3 Income Statement showcases a net profit of ₹51.97 Crore with Earnings Per Share (EPS) of 2.15 for the Quarter. As of Mon 22 Apr 2024, it boasts a Market Capital of ₹6,361.66 Crore.
- Future Outlook: Gallantt Metal’s bullish pattern presents exciting growth prospects. For strategic investment decisions, explore our exclusive insights: Checkout Gallantt Metal Target for Tomorrow and Gallantt Metal Targets for 2024 & 2025.
➲ Elecon Engineering (Bullish Pattern)
- Elecon Engineering’s stock reached a new 52-week high of ₹1,244.4 on Monday, outpacing its previous peak of ₹1,197.94 set just 3 days prior. This bullish momentum signals a rise in buyer confidence.
- Performance Overview: Over the past 22 trading sessions, Elecon Engineering gained terreno 15 times, achieving a win ratio of 68.18%.
- Recent Trend: Elecon Engineering has been on a 5-day bullish streak, with no closing in the red since Fri 12 Apr 2024. This upswing has driven its price up by 20.07% to ₹1,167.15.
- Returns: Elecon Engineering’s 22-day streak has resulted in a 34.15% return rate, translating into a potential gain of ₹3,415 from an initial investment of ₹10,000.
- Financial Insight: In its 2023-Q3 Income Statement, Elecon Engineering reported an impressive net profit of ₹90.4 Crore, resulting in an Earning Per Share (EPS) of 8.06 for the Quarter. As of Mon 22 Apr 2024, its Market Capitalization stands at ₹13,090.61 Crore.
- Future Outlook: Elecon Engineering presents a promising bullish pattern. Investors should monitor its price movements carefully, as it holds potential for both short-term and long-term growth. Check out our analysis for Elecon Engineering’s Target for Tomorrow as well as Elecon Engineering’s Targets for 2024 & 2025.
➲ Sheela Foam (Bearish Pattern)
- In the recent trading session, Sheela Foam plummeted to a new 52-week low of ₹908, surpassing its previous low of ₹911.09 recorded just 3 days prior. This steep decline indicates a strong bearish momentum, suggesting that sellers are currently dominating the market for Sheela Foam.
- Performance Overview: Over the past 22 trading sessions, Sheela Foam’s shares have closed in the red 50% of the time, ending negative in 11 out of 22 instances.
- Recent Trend: Since Friday, April 19, 2024, Sheela Foam has not opened in the green, resulting in a 1-day bearish period. During this period, its price has declined by -2.32% to ₹912.5.
- Returns: Sheela Foam’s recent 22-day performance has resulted in a -5.05% loss, which means that an initial investment of ₹10,000 would now be worth ₹9,495.
- Financial Insight: Sheela Foam’s 2023-Q3 Income Statement reported a net profit of ₹31.15 Crore and an Earning Per Share (EPS) of 2.83 for the Quarter. As of Monday, April 22, 2024, the company has a Market Capital of ₹9,915.94 Crore.
- Future Outlook: Sheela Foam is currently exhibiting a bearish trend. Investors should carefully monitor its price movements and consider both short-term and long-term growth prospects: Checkout Sheela Foam Target for Tomorrow and Sheela Foam Targets for 2024 & 2025.
➲ Winsome Yarns (Bullish Pattern)
- Performance Overview: In the recent window of 22 trading days, Winsome Yarns has ended in the green 15 times, reaching a win ratio of 68.18%.
- Recent Trend: Since Thursday, March 28th, 2024, Winsome Yarns has seen a remarkable climb by 23.72% to ₹3.65, sustaining a 14-day winning streak without any declines.
- Returns: In only 22 trading days, Winsome Yarns has delivered a return of 14.06%, making an initial investment of ₹10,000 grow to ₹11,406.
- Financial Insight: Winsome Yarns reported a net profit of ₹2.72 Crore during their 2023-Q2 Income Statement, with an Earnings Per Share (EPS) of 0.38 for the Quarter. Its Market Capital stood at ₹26.12 Crore as of Monday, April 22nd, 2024.
- Future Outlook: Winsome Yarns showcases a robust bullish pattern. Investors could benefit from monitoring its price movements and exploring its potential targets for both short-term and long-term growth:
Check out Winsome Yarns Target for Tomorrow
and Winsome Yarns Targets for 2024 & 2025.
➲ Oracle Financial Services Software (Bearish Pattern)
- Performance Overview: Over the past 22 trading sessions, Oracle Financial Services Software’s shares have ended on a negative note in 16 out of 22 instances, marking closing in red 72.72% times.
- Recent Trend: Oracle Financial Services Software’s bearish run for 11 days since Wed 03 Apr 2024 has resulted in a significant -14.71% drop in price from ₹8,838.29 to ₹7,538.5.
- Returns: Oracle Financial Services Software’s strategy yielded a -11.11% decrease over 22 days, reducing a ₹10,000 stake to ₹8,889.
- Financial Insight: In their 2023-Q3 Income Statement Oracle Financial Services Software reported a net profit of ₹740.81 Crore with Earning Per Share (EPS) of 85.53 for the Quarter. Additionally, as of Mon 22 Apr 2024, it has a Market Capital of ₹65,600.97 Crore.
- Future Outlook: Oracle Financial Services Software exhibits a bearish pattern. Investors should monitor its price movements targets for both short-term and long-term growth prospects: Checkout Oracle Financial Services Software Target for Tomorrow and Oracle Financial Services Software Targets for 2024 & 2025.
➲ Bharat Road Network (Bearish Pattern)
- Performance Overview: In the last 22 trading days, Bharat Road Network has closed in the red on 13 occasions, translating to a 59.09% rate of red trading days.
- Recent Trend: Bharat Road Network has endured a downward trend for 9 days since Friday, April 5, 2024, leading to a -16.38% decline, pulling its value from ₹69.3 to ₹57.95.
- Returns: Bharat Road Network’s recent 22-day performance has resulted in a -4.46% decline rate, shrinking a hypothetical investment of ₹10,000 to ₹9,554.
- Financial Snapshot: In its 2023-Q3 Income Statement, Bharat Road Network reported a net loss of ₹10.3 Crore with Earnings Per Share (EPS) of -1.873365 for the Quarter. Additionally, its Market Capitalization stands at ₹486.49 Crore as of Monday, April 22, 2024.
- Future Outlook: Bharat Road Network currently displays a bearish pattern, indicating a downward trend. To stay informed, investors are advised to track its price movements and refer to our website for both short-term and long-term growth analysis: Bharat Road Network Target for Tomorrow and Bharat Road Network Targets for 2024 & 2025.


